( MS4s) Jon M. Capacasa, Director U.S. EPA Region 3 Water - - PowerPoint PPT Presentation

ms4s
SMART_READER_LITE
LIVE PREVIEW

( MS4s) Jon M. Capacasa, Director U.S. EPA Region 3 Water - - PowerPoint PPT Presentation

Stormwater: Challenges and Solutions for Municipal Sources ( MS4s) Jon M. Capacasa, Director U.S. EPA Region 3 Water Protection Division Chesapeake Bay Commission Meeting Alexandria, VA September 11, 2015 1 Source: U.S. Department of


slide-1
SLIDE 1

Stormwater: Challenges and Solutions for Municipal Sources ( MS4s)

Jon M. Capacasa, Director U.S. EPA Region 3 Water Protection Division Chesapeake Bay Commission Meeting Alexandria, VA September 11, 2015

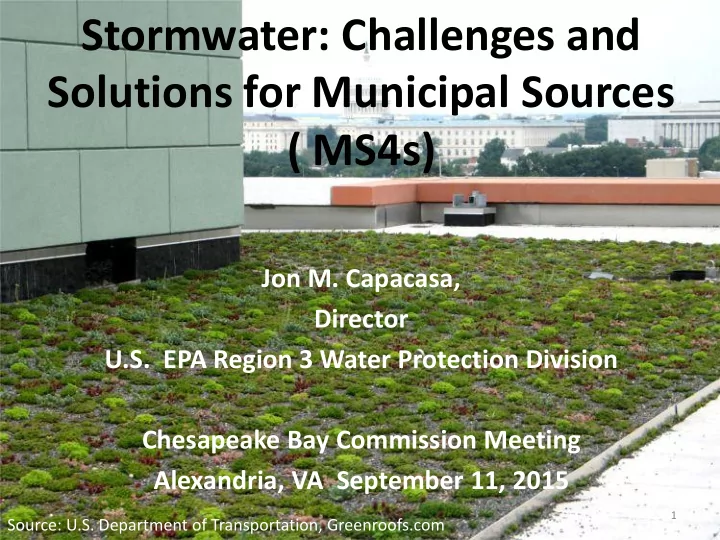
Source: U.S. Department of Transportation, Greenroofs.com

1

slide-2
SLIDE 2
  • Urban stormwater is a leading source of impairment
  • Fast growing water quality concern
  • Approximately 800,000 acres being developed every year
  • Development adds impervious areas to the landscape
  • A small increase in impervious cover = big impacts in receiving waters
  • Development upstream can cause downstream impacts in communities
  • Local governments face growing wet weather-related control costs

About 60% of regulated MS4s discharge to impaired waters

Stormwater Impacts on the Bay and Local Waters

slide-3
SLIDE 3

3

Sources of Pollution to the Bay

Agriculture – animal manure, commercial fertilizer

Air pollution – tailpipes, power plants

Urban/suburban runoff– fertilizer, stream erosion

Wastewater – sewage treatment plants

slide-4
SLIDE 4

A municipal separate storm sewer system (MS4) is:

A conveyance or system of conveyances... owned by a State, city, town, or other public entity that discharges to waters of the U.S. and is:

– designed or used for collecting or conveying stormwater (not a combined sewer) – not part of a Publicly Owned Treatment Works (POTW)

4

What is an MS4?

  • EPA regulates MS4s using a two-phased approach:

Phase I MS4s – population greater than 100,000 when rule adopted Phase II MS4s – smaller communities within a designated urbanized area, and updated with each census

slide-5
SLIDE 5
slide-6
SLIDE 6
  • Public Education and Outreach
  • Public Involvement/Participation
  • Illicit Discharge Detection & Elimination
  • Construction Site Stormwater Runoff Control
  • Post-Construction Stormwater Management
  • Pollution Prevention/Good Housekeeping
  • Industrial/Commercial Monitoring (Phase I only)

6

Elements of the MS4 Program

slide-7
SLIDE 7

R3 MS4 Permit Renewals

  • 16 of 24 Phase I permits in Bay

Watershed recently reissued

– Pending are:

  • VA Tidewater permits
  • MD SHA and Montgomery Co.
  • 3 of 5 Phase II State-wide

General Permits reissued

– MD & DE permits were submitted to EPA and reviewed. Expect issuance by end of 2015

  • About 450 Phase II permittees in

the Bay watershed (more

expected as a result of 2010 census)

7

Status of Renewal of MS4 Permits

slide-8
SLIDE 8

% Reduction in Statewide Loads % Reduction in Urban Loads % Total Load Reductions Attributable to Urban Sector N P TSS N P TSS N P TSS Delaware 26% 31% 27% 13% 12% 5% 4% 2% 5% D.C. 19%

  • 68%

5% 13% 22% 16% 5% N.A. 255% Maryland 21% 20% 16% 24% 28% 29% 21% 30% 66% New York 13% 30% 25% 8% 20% 10% 7% 9% 12% Pennsylvania 30% 29% 28% 41% 45% 50% 20% 24% 39% Virginia 18% 25% 24% 13% 21% 30% 10% 14% 23% West Virginia 8% 31% 32% 3% 44% 50% 6% 18% 37% Negative values indicate increases in loads from 2009 to Phase II WIP planning targets, typically due to increases in wastewater treatment flow up to design capacity.

Phase II WIP Commitments: State by State Load Reductions from 2009 to 2025

8

slide-9
SLIDE 9

MS4 Permit Requirements 2010 Region 3 Stormwater Approach

+ CLEAR, MEASURABLE PROVISIONS – ENFORCEABILITY

+ ACCOUNTABILITY MECHANISMS + POST-CONSTRUCTION PERFORMANCE STANDARDS + RETROFITTING REQUIREMENTS + PLANS TO IMPLEMENT TMDL ALLOCATIONS (WATER QUALITY BASED PERMITS) + WATER QUALITY TRADING PROVISIONS + CONSIDERATION OF FEDERAL FACILITIES

9

EPA CLARIFIED WHAT STATES SHOULD INCLUDE WHEN RENEWING MS4 PERMITS:

slide-10
SLIDE 10

State Highlights:

  • MD – 20% restoration of regulated impervious surface area in
  • ne permit term; requirement for use of Environmental Site

Design

  • VA – phased approach to achieve Bay WIP reductions in 3 permit

terms (5% load reduction in first term)

  • PA – newly required Bay TMDL pollutant reduction plans

– A commitment to enhance the Phase II Permit in next round by including numeric pollutant reductions; early start on next round of permits.

**TMDL/restoration Plans must incorporate annual compliance milestones and deadlines

10

Improvements in R3 MS4 Permits

slide-11
SLIDE 11

State Highlights:

–DC (EPA-issued MS4 permit)

  • New On-site retention performance standard – 90% storm

capture (1.2”) for new or redevelopment

  • Enforceable Green provisions (i.e. tree plantings,

green roof acres, etc.)

  • Innovative storm water retention credit trading

program; new City-wide regulations

–WV – capture 85% of storm runoff - performance

standard for all Phase II permittees

–DE – 3% decrease: untreated effective impervious area

Improvements in R3 MS4 permits

slide-12
SLIDE 12
  • EPA has been active in audits/inspections of MS4s

– 26 Phase I’s and 47 Phase II’s inspected since 2008 – More Annual Report and File Reviews conducted – High rate of non-compliance, but recently improving – Compliance Orders and Penalties for significant issues

  • State-wide Stormwater program assessments were performed for

each R3 jurisdiction/state

  • Conducted MS4 Permittee and Inspector Training on various
  • ccasions

– 150 attended VA MS4 Forum this spring! – State and National Inspector trainings - PA, VA, and Baltimore (national) – Sharing lessons learned from audits, peer to peer exchange

Compliance/Enforcement

slide-13
SLIDE 13
  • Legal Appeals Slow Permitting Pace
  • Lost full permit cycle +
  • The pace to meet our 2025 goals
  • The Cost of Retrofits
  • WQ improvements require progress in the built environment
  • Most costly BMPs; savings possible when part of ongoing

redevelopment

  • GI and new financing tools have promise here
  • State Program & Local Gov’t Capacity

(Funding/Financing)

– Baseline is a low rate of compliance

  • Ambitious allocations to this source
  • Reducing the appropriate sediment source

– Overland flow vs in-stream scouring

Implementation Challenges

slide-14
SLIDE 14
slide-15
SLIDE 15

0.0 0.5 1.0 1.5 2.0 2.5 1985 Progress 2009 Progress 2014 Progress 2017 Target 2025 Target

Sediment

billion lbs/year

5 10 15 20 25 30 35 40 45 1985 Progress 2009 Progress 2014 Progress 2017 Target 2025 Target

Nitrogen

million lbs/year

0.0 0.5 1.0 1.5 2.0 2.5 3.0 3.5 1985 Progress 2009 Progress 2014 Progress 2017 Target 2025 Target

Phosphorus

(million lbs/year) Source: Chesapeake Bay Program (April 2015)

Faster Pace Needed for Urban/Suburban Sector

slide-16
SLIDE 16

Issue Brief – State Permit Status

–Will MS4 Permits deliver the pollution reductions planned in state Watershed Implementation Plans by 2025? –MD, PA, VA status (see briefing paper)

slide-17
SLIDE 17
  • Traditional Funding Types:

– Dedicated general funds – In-lieu programs – Grants – Special service districts – Municipal bonds – User-based fee

  • Non-traditional Funding/Financing Types:

– Market-based Approaches – Trading and Offsets – Clean Water State Revolving Funds (SRF) – Community Based Public-Private Partnerships (CBP3s)

Funding Options for MS4s

slide-18
SLIDE 18

National Coverage

  • Virginia has 21 SWUs

U.S. EPA, 2009, New England Environmental Finance Center, 2005

~1,500 today

Western Kentucky University, 2014

Stormwater Utilities – A National View

slide-19
SLIDE 19

Western Kentucky University, 2014

slide-20
SLIDE 20

EPA Region 3 Focus

  • “Faster, Cheaper, Greener”

Solutions for Communities

– Green Infrastructure (GI)

– New Financing tools – Retrofit Cost Reduction

  • A “Center of Excellence” for GI
slide-21
SLIDE 21

The G3 Initiative

Green Streets, Green Jobs, Green Towns

  • EPA Region 3 program begun in

2011 - (Chesapeake Bay Trust and MD DNR as partners)

  • Over 60 local government

grants awarded between 2001- 14; in every state in R3

  • Investing over $4.9 Million into

green initiatives from the partners resulting in over $9 Million in projects

  • Enhancing quality of life in

communities while meeting

  • ur stormwater goals
slide-22
SLIDE 22
  • Urban Stormwater Runoff

– Growing sector in loading – Seeking “Faster, Cheaper, Greener” solutions for cities to meet the challenge

  • EPA “Green Streets”

– A sustainable stormwater management strategy that also contributes to community redevelopment

  • Multiple benefits

– Avoided stormwater treatment costs – Reduced flooding – Reduced energy costs (green roofs, tree canopy) – Pedestrian/ biking access – Air-quality improvements – Heat island impacts – Increased home values – Habitat benefits

Addressing Urban Stormwater- Green Streets, Green Jobs, Green Towns

slide-23
SLIDE 23

GI and Financing

  • CBP3 – Community Based Public-Private-

Partnerships

  • Using Credit/Offset programs in urban areas

to drive private investment

  • Certification program development to

promote green designs (LEED-like programs)

slide-24
SLIDE 24

GI and Financing – The CBP3

  • Community Based Public-Private Partnerships

(CBP3)

  • “Faster-Cheaper-Greener” Webcast Series
  • Seeking demonstration communities across

the Region

  • Prince Georges County and others
  • A “Guide for Local Governments” is available

from EPA Region III

slide-25
SLIDE 25

1st Stormwater CBP3 Demonstration Pilot !

slide-26
SLIDE 26

Provide greater delivery & capacity for market- based approaches; Accelerate the pace Create economic feasibility; Better leverage local government resources; Foster improved, affordable GI BMPs; Expedite project delivery over the long term (O&M); Spur local economic development; Show transparency for community; Drive down costs; and, Sustained regulatory compliance.

A partnership with the private sector designed to:

Community-Based Public Private Partnerships (CBP3) for achieving affordable GI-Driven SW Retrofits…

slide-27
SLIDE 27

Phila offers up to 80% Fee Credit for the Management of 1” of stormwater

Rain Garden

Porous Pavement

Sub-surface Detention Pond

Green Roof

Surface Detention Pond

Stormwater Wetland

Stormwater Fee Credits

slide-28
SLIDE 28

Market-based Approaches

  • Stormwater Volume Trading
  • District of Columbia’s Stormwater

Retention Credit (SRC) program

  • Half on-site control required, rest can be

purchased

  • Credit buyers in urban core, credit

generators in outlying urban districts

  • Can lead to social and environmental

benefits and economic efficiencies

  • First trade occurred in September, 2014!!!
slide-29
SLIDE 29

Jon M. Capacasa Director, EPA Region 3 Water Protection Division (215) 814-5422, capacasa.jon@epa.gov Liz Ottinger Permit Engineer, EPA Region 3 Water Protection Division (215) 814-5783, ottinger.elizabeth@epa.gov

29