
SLIDE 1
MRDS Example: faecal pellet survey
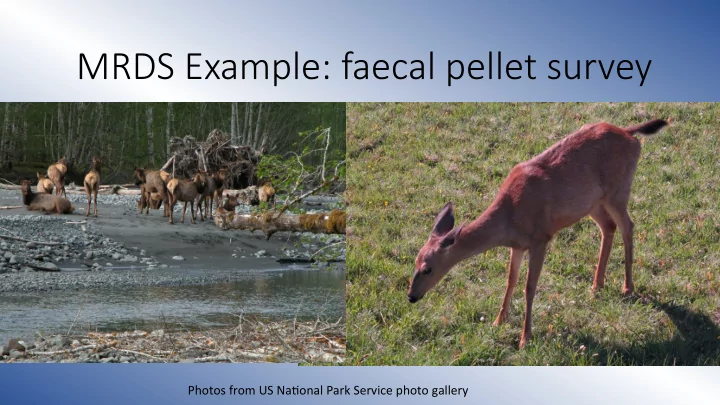
Photos from US Na.onal Park Service photo gallery
MRDS Example: faecal pellet survey Photos from US Na.onal Park - - PowerPoint PPT Presentation
MRDS Example: faecal pellet survey Photos from US Na.onal Park Service photo gallery Pellet survey design Survey of faecal pellets of elk and deer in Olympic Na.onal Park, Washington, USA, to es.mate abundance: Double observer line
Photos from US Na.onal Park Service photo gallery
trail)
faecal pellet groups within 2m of centre line
transect surveys. M. E. E. doi: 10.1111/2041-210X.12294 Appendix S2: Running an MRDS analysis is Distance and R: a tutorial
50 100 150 0.0 0.2 0.4 0.6 0.8 1.0 Distance Detection probability 50 100 150 0.0 0.2 0.4 0.6 0.8 1.0 Distance Detection probability 50 100 150 0.0 0.2 0.4 0.6 0.8 1.0 Distance Detection probability 50 100 150 0.0 0.2 0.4 0.6 0.8 1.0 Distance Detection probability
MR model: distance + sizegroup
Obs 1 | Obs 2 Obs 2 | Obs 1
DS model: hazard rate, no covars Point independence = DS + MR Full independence = MR
50 100 150 0.0 0.2 0.4 0.6 0.8 1.0 Distance Detection probability
Point independence Full independence Es6mates Model used Es6mate Model used Es6mate Probability of detec.on assuming g(0)=1 DS 0.69 (0.03)
MR 0.94 (0.01) MR 0.94 (0.02) Overall probability of detec.on MRDS 0.65 (0.03) MR 0.86 (0.02) Es.mated N in covered region 2116 (0.04) 1601 (0.02)
Summary for io.fi object MR model
Number of observations : 1380 Pooled Number seen by primary : 1094 Observer 1 Number seen by secondary : 1102 Observer 2 Number seen by both : 816 Duplicates AIC : 2457.952 Conditional detection function parameters: estimate se (Intercept) 0.28098736 0.188557908 distance -0.00835025 0.001517454 sizegroup2 0.46927834 0.207238009 sizegroup3 1.78569572 0.193560108 sizegroup4 3.19715740 0.440773795 Estimate SE CV Average primary p(0) 0.7952424 0.017075328 0.02147185 Average secondary p(0) 0.7952424 0.017075328 0.02147185 Average combined p(0) 0.9416874 0.009603405 0.01019808
Summary for ds object
Number of observations : 1380 Distance range : 0 - 150 AIC : 13612.95 Detection function: Hazard-rate key function Detection function parameters Scale coefficient(s): estimate se (Intercept) 4.425513 0.05855335 Shape coefficient(s): estimate se (Intercept) 0.6851006 0.1247415 Estimate SE CV Average p 0.6924608 0.02190796 0.03163784
Summary for io object MRDS model
Total AIC value : 16070.9 = 2457.952 + 13612.95 Estimate SE CV Average p 0.6520816 0.02167574 0.03324085 N in covered region 2116.2996331 78.02162494 0.03686700
𝑂 ↓𝑑𝑝𝑤𝑓𝑠𝑓𝑒 = 1380/0.652
DS model assuming g(0)=1
Overall distances On the trackline
𝑂 ↓𝑑𝑝𝑤𝑓𝑠𝑓𝑒 = 1380/0.862
Summary for io.fi object MR model
Number of observations : 1380 Pooled Number seen by primary : 1094 Observer 1 Number seen by secondary : 1102 Observer 2 Number seen by both : 816 Duplicates AIC : 16217.81 Conditional detection function parameters: estimate se (Intercept) 0.28098736 0.188557908 distance -0.00835025 0.001517454 sizegroup2 0.46927834 0.207238009 sizegroup3 1.78569572 0.193560108 sizegroup4 3.19715740 0.440773795 Estimate SE CV Average p 0.8617999 0.014769988 0.01713854 Average primary p(0) 0.7854780 0.015519397 0.01975790 Average secondary p(0) 0.7854780 0.015519397 0.01975790 Average combined p(0) 0.9368971 0.009788271 0.01044754 N in covered region 1601.2998003 32.267117776 0.02015058
Overall distances On the trackline