
SLIDE 1
Motilal Oswal Financial Services Ltd Earnings Presentation | Q3FY18 - - PowerPoint PPT Presentation
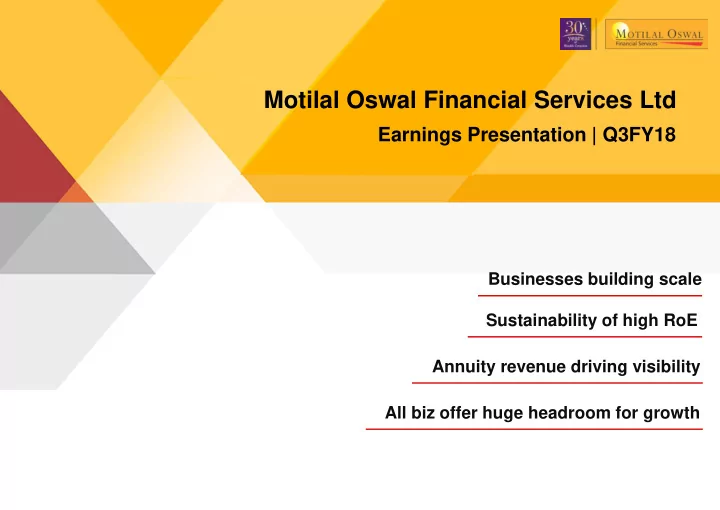
Motilal Oswal Financial Services Ltd Earnings Presentation | Q3FY18 Businesses building scale Sustainability of high RoE Annuity revenue driving visibility All biz offer huge headroom for growth Key Highlights Financials Businesses
Highest-ever quarterly Broking revenue Share in high yielding cash segment up strongly Strong growth of +112% YoY in Distribution AUM to Rs 75 bn Broking business core profits +88% YoY Concluded 11 investment banking deals in 9MFY18; deal pipeline remains robust Capital Market business profits +92% YoY
AMC net sales: Rs 36 bn, +119% YoY in Q3FY18; AUM: Rs 350 bn, +126% YoY Equity MF AUM share 1.9% in 9MFY18 vs 1.4% in 9MFY17; flow share 4% in 9MFY18 vs 2.7% 9MFY17 Average IRR on exited PE investments: ~27% Wealth AUM: Rs 153 bn, +67% YoY; EBITDA margin of 36% in 9MFY18 (+700bps YoY) Asset & Wealth Management business profits +277% YoY Unrealised gain on quoted equity investments: Rs 7 bn – not included in earnings
be part of reported earnings from FY19 Reported RoE of 12% in fund based business. Post-tax cumulative XIRR of ~30% on equity investments RoE of 40% including unrealised gains (28% ex-unrealised gains) Interim dividend of Rs 4/share (Pay out policy
Loan book growth: 48% YoY at Rs 49.4 bn Disbursements are cautiously calibrated Asset quality deteriorated Dedicated collection
Collection headcount up 68% QoQ. Continues to be in investment mode
Note: All AUM figures are for Q3FY18, unless otherwise mentioned
4
Notes:
Capital Markets# 111% in Q3FY18 Asset Management 214% in Q3FY18 Housing Finance 0% in Q3FY18 Fund based business 13% in Q3FY17 Capital Markets# 60% in Q3FY17 Asset Management 86% in Q3FY17 Housing Finance 12% in Q3FY17 Fund based business 12% in Q3FY18 MOFSL Consolidated 28% RoE (Inc- Unrealised Gain is 40%) in Q3FY18 MOFSL Consolidated 21% in Q3FY17
6
(10% of NWE) (6% of NWE) (35% of NWE) (49% of NWE) (9% of NWE) (5% of NWE) (34% of NWE) (52% of NWE)
Notes :
850mn in Q2FY18.
forward in the balance sheet as MAT credit receivable. As a result, effective tax rate during the quarter higher at 31%. Profit is lower to that extent.
for 9MFY18 were charged as people cost. Profit is lower to that extent.
7 Particulars (Rs mn) Q3FY18 Q3FY17 YoY (%) Q2FY18 QoQ (%) 9MFY18 9MFY17 YoY (%) FY17 Broking 2,674 1,516 76% 2,193 22% 6,843 4,680 46% 6,396 Investment Banking 444 148 200% 220 101% 894 432 107% 855 Asset & Wealth Management 2,199 1,000 120% 2,549
6,247 3,671 70% 5,102 Fund Based 491 351 40% 361 36% 1,274 1,003 27% 1,174 Housing Finance 1,533 1,525 0% 1,804
4,937 4,010 23% 5,705 Total Revenues 7,362 4,555 62% 7,144 3% 20,266 13,853 46% 19,315 EBITDA 3,579 2,617 37% 3,713
10,031 7,551 33% 10,182 PBT 2,152 1,228 75% 2,314
5,852 3,777 55% 5,152 Reported PAT 1,481 891 66% 1,438 3% 3,934 2,698 46% 3,600 PAT (Ex-Aspire) 1,474 734 101% 1,221 21% 3,574 2,192 63% 2,818
8 Particulars (Rs mn) Q3FY18 Q3FY17 YoY (%) Q2FY18 QoQ (%) 9MFY18 9MFY17 YoY (%) FY17 Capital Market 564 294 92% 411 37% 1,261 767 64% 1,064 Asset & Wealth Management 596 158 277% 715
1,607 1,000 61% 1,257 Housing Finance 6 168
216
358 518
793 Fund Based 315 271 16% 95 230% 708 413 71% 486 Total PAT 1,481 891 66% 1,438 3% 3,934 2,698 46% 3,600 PAT Mix (%) Capital Market 38% 33% 29% 32% 28% 30% Asset & Wealth Management 40% 18% 50% 41% 37% 35% Housing Finance 0% 19% 15% 9% 19% 22% Fund Based 21% 30% 7% 18% 15% 14%
Notes : *Loan Fund includes borrowings of Aspire Home Finance; Ex- Aspire net borrowings is Rs 14 bn as at December 2017. Market value of investment is Rs 15 bn ** Long Term Loan & Advances includes loans given by Aspire Home Finance
9 Particulars (Rs bn) 9MFY18 9MFY17 FY17 Sources of Funds Net Worth 21.6 17.3 17.9 Loan Funds* 58.1 45.9 50.7 Minority Interest 0.3 0.3 0.3 Deferred Tax Liability 0.4 0.2 0.4 Total 80.5 63.6 69.2 Application of Funds Fixed Assets (Net Block) 2.7 2.6 2.6 Investments 20.9 23.3 18.0 Long Term Loan & Advances** 49.0 33.2 41.1 Net Current Assets 7.9 4.6 7.4 Total 80.5 63.6 69.2
Rs 2.2 bn, + 75% YoY; and PAT at Rs 1.48 bn, +66% YoY
(+87% YoY), Asset Management business (+120% YoY), and Fund based business (+40% YoY). Profit growth was majorly contributed by Asset Management (+277% YoY) and Capital Markets business (+92% YoY).
investments to fund future investments. Overall gearing remains conservative at 2.7x; ex-Aspire it is at 0.9x. Considering market value
Broking & Distribution: Margins led by Distribution
24% YoY, respectively.
bn led by strong net sales of Rs 9.6 bn, +170% YoY.
Housing Finance: Ample headroom for growth
Asset Management: Market share gains to drive strong growth
Equity MF Flows market share increased to 4%
Wealth Management: Profitability inflection commenced
YoY, respectively
quarterly net sales of Rs 10 bn, +141% YoY in Q3FY18
Revenue mix trend (Rs bn) PAT mix trend (Rs mn)
10
4.8 4.9 7.3 5.1 7.7 1.6 2.6 5.1 3.7 6.2 0.2 2.2 1.2 1.0 1.3 1.1 1.1 5.7 4.0 4.9
FY15 FY16 FY17 9MFY17 9MFY18 Capital Market Asset & Wealth Mgt Housing Finance Fund based 7.8 10.9 19.3 20.3 13.9
894 383 1,064 767 1,261 198 373 1,257 1,000 1,607 22 391 793 518 358 322 544 486 413 708
FY15 FY16 FY17 9MFY17 9MFY18 Capital Market Asset & Wealth Mgt Housing Finance Fund based
1,436 1,691 3,600 3,934 2,698
Highest-ever quarterly revenue Strong operating leverage Robust growth in Distribution AUM
Continues to be in investment mode Dedicated collection engine is now in place Rising pool of realised and unrealised gain Cumulative post-tax XIRR: ~30% on equity investment
Highest-ever net sales Significant operating leverage Strong carry income
due to zero fund based income booked in Q3FY18 vs Rs 215 mn in Q3FY17. Higher tax rate of 37% (+19% YoY) resulted in PAT decline of 11%.
equity-focused captive products. AUM was Rs 75 bn, +112% YoY. With only ~9% of our client base and ~20%
improved strongly on QoQ and YoY basis, resulting into improvement in overall market share to 2.1% in
benefit from new regulation on margin funding. Unrealised gain on liquid investments in MOSL at Rs 550 mn Distribution AUM picked up strongly to Rs 75 bn, +112% YoY Healthy volume growth; gained share in high-yield cash segment MOSL Standalone 13 Highest-ever quarterly broking revenue Particulars (Rs mn) Q3FY18 Q3FY17 YoY (%) Q2FY18 QoQ (%) 9MFY18 9MFY17 YoY (%) FY17 Total Revenues 2,889 1,834 58% 2,463 17% 7,761 5,216 49% 7,197 EBITDA 922 747 24% 805 15% 2,453 1,815 35% 2,275 EBITDA Margin 32% 41%
35%
PBT 602 520 16% 528 14% 1,619 1,185 37% 1,429 PAT 382 429
349 9% 1,117 904 24% 1,088
total clients to 0.94 mn
lifetime high of 1,500+
cross-sell penetration
average ticket size of Rs 5,000
money Polls.
based team servicing
counterpart Distribution penetration (% of total client base of 0.9 mn) Trail-based annuity income picking up 14
5.7% 6.4% 7.3% 7.9% 9.0% FY15 FY16 FY17 9MFY17 9MFY18 5,426 5,496 7,197 5,216 7,761 11.0% 10.1% 13.8% 11.4% 16.8% FY15 FY16 FY17 9MFY17 9MFY18
MOSL Revenue (Rs mn) Retail Distribution to Retail Gross Revenue (%)
Rising Distribution AUM (Rs bn) DP AUM growth trend (Rs bn) MOSL Broking ADTO (Rs bn)
Market ADTO (Rs bn) – Cash and F&O 15
213 202 247 227 318 3,127 2,806 3,821 3,608 6,074 FY15 FY16 FY17 9MFY17 9MFY18 Cash ADTO F&O ADTO 3,340 3,007 4,068 3,836 6,391 67% 227 256 450 361 696 FY15 FY16 FY17 9MFY17 9MFY18 93% 15 18 44 35 75 FY15 FY16 FY17 9MFY17 9MFY18 112% 51 59 85 83 128 FY15 FY16 FY17 9MFY17 9MFY18 54%
Market cap to GDP trend Corporate profit to GDP trend Retail ADTO registered faster growth (%)
16
3.0 4.7 5.4 6.2 7.3 7.8 5.5 6.5 6.2 4.9 4.6 4.3 3.8 3.1 2.9 3.0 FY03 FY04 FY05 FY06 FY07 FY08 FY09 FY10 FY11 FY12 FY13 FY14 FY15 FY16 FY17 YTDFY18 Decade average : 4.6% 23 42 52 82 83 103 55 95 88 71 64 66 81 69 80 100 FY03 FY04 FY05 FY06 FY07 FY08 FY09 FY10 FY11 FY12 FY13 FY14 FY15 FY16 FY17 YTDFY18 6 6.9 6.7 13.1 5.1 28.6 30.3 India Treasury Bill Bank FD 10 Year G- Sec Gold $ Gold INR Nifty Index Nifty Index Total
(%) (%) (%)
Higher returns in equity asset class in CY17
15 18 12 15 59 31
10 8 14 22 7 60 42 26 5 62 21
9 Retail ADTO MF AUM Insurance Premium Bank Deposits FY14 FY15 FY16 FY17 YTDFY18
Source: NSE, BSE, AMFI, IRDA, RBI
performance in the capital markets business.
Bank (Rs 4,013 mn) and LT Foods (Rs 3,993 mn, as Sole BRLM), and the IPO of MAS Financial (Rs 4,600 mn, as Sole BRLM). 17
IPO - Rs 19.1 bn QIP - Rs 49.9 bn QIP - Rs 4.0 bn
IPO - Rs 4.6 bn (√ Sole)
QIP - Rs 3 bn QIP - Rs 4 bn (√ Sole)
Particulars (Rs mn) Q3FY18 Q3FY17 YoY (%) Q2FY18 QoQ (%) 9MFY18 9MFY17 YoY (%) FY17 Total Revenues 456 151 202% 225 103% 921 444 108% 872 EBITDA 289 131 121% 180 60% 637 252 153% 561 EBITDA Margin 63% 87%
57%
PBT 288 130 123% 179 61% 635 247 157% 554 PAT 177 87 104% 128 38% 454 170 167% 372
18
Rs bn
funds raised in FY17.
Industry trend in ECM transactions
IPO - Rs 2.1 bn IPO - Rs 4.8 bn QIP - Rs 5.5 bn IPO - Rs 7.2 bn Preferential Issue - Rs 16.8 bn (√ Sole)
No's 433 185 195 689 142 70 86 20 139 270 760 232 37 344 237 35 52 84 321 189 48 598 20 40 60 80 100 120 140 160 180 100 200 300 400 500 600 700 800 CY07 CY08 CY09 CY10 CY11 CY12 CY13 CY14 CY15 CY16 CY17 IPO/FPO (LHS) QIP (LHS) QIP - No of Companies (RHS) IPO/FPO - No of Companies (RHS)
Source: NSE, Prime database
Highest-ever quarterly revenue Strong operating leverage Robust growth in distribution AUM
Continues to be in investment mode Dedicated collection engine is now in place Rising pool of realised and unrealised gain Cumulative post-tax XIRR: ~30% on equity investment
Highest-ever net sales Significant operating leverage Strong carry income
YoY), PMS AUM at Rs 157 bn (+96% YoY), and AIF AUM at Rs 19.9 bn (+417% YoY).
This is mainly on account of better pricing power in MF coupled with rising share of direct channel in net sales – up from 13% in Q3FY17 to 31% in Q3FY18.
average SIP at ~Rs 5,000 per month is much higher than the industry average of Rs 3,500 per month.
This addresses the unique challenge of gaining materiality in a market that is witnessing staggering growth.
keeps distribution costs low, but also minimizes channel conflicts. Highest quarterly Net Sales of Rs 36 bn, +119% YoY AMC AUM Rs 350 bn in Q3FY18, 126% YoY Rank in Equity AUM* 9 in Dec 2017 Market leader in PMS with 15.4% market share in AUM
Share** ~4% in Net Flows
Note : * Carry income in AMC will be booked in Q4 of every year
Notes: *Rank includes our AUM in Equity MF, PMS & AIF; Industry AUM includes Equity MF assets excl Arbitrage funds **Includes only Open-Ended Equity Mutual Funds
20 Particulars (Rs mn) Q3FY18 Q3FY17 YoY (%) Q2FY18 QoQ (%) 9MFY18 9MFY17 YoY (%) FY17 AUM (bn) 350 155 126% 289 21% 350 155 126% 203 Net adds (bn) 36 16 119% 36 1% 97 38 156% 62 Total Revenues 1,695 877 93% 1,466 16% 4,509 2,208 104% 3,413 Total costs 1,215 655 86% 1,107 10% 3,322 1,715 94% 2,648 EBITDA 479 222 116% 359 33% 1,187 493 140% 765 EBITDA Margin 28% 25%
22%
PBT 478 220 117% 358 34% 1,182 489 142% 759 PAT 303 145 109% 233 30% 768 321 139% 498
resulted from MOAMC’s niche equity focus, process-oriented (QGLP) approach and solid performance track record.
9MFY17). We have a steady pipeline for fund-raising, with tie-ups already in place.
1 Inception Date: 25/03/2003. These returns are of a Model Client as on 31stDec 2017. Returns of individual clients
may differ depending on time of entry in the strategy. Past performance may or may not be sustained in future and should not be used as a basis for comparison with other investments. Returns shown are post fees and expenses. Benchmark is Nifty 50 Index * Read above fund performances with their corresponding Disclaimers in the funds’ Fact Sheets, which are available in www.motilaloswalmf.com.
Higher equity MF net sales market share would pull equity MF AUM share up eventually
Product Scheme Strategy Inception Date Total Return Alpha over Benchmark PMS Value Large- Cap 25-Mar-03 25% 8% PMS NTDOP Multi-Cap 11-Dec-07 20% 10% PMS IOP Mid-Cap 15-Feb-10 19% 5% Mutual Fund F-25 Large- Cap 13-May-13 18% 5% Mutual Fund F-35 Multi-Cap 28-Apr-14 31% 14% Mutual Fund F-30 Mid-Cap 24-Feb-14 31% 1% 21
Note : *Equity AUM market share is based on Avg AUM. As on Dec ’ 17, our AUM share is 2.1%
0.6% 1.2% 1.5% 1.4% 1.9% 2.1% 3.8% 3.0% 2.7% 4.0% FY15 FY16 FY17 9MFY17 9MFY18 MF AUM Market Share Net sales Market share
MOAMC AUM breakup MOAMC’s has “Zero” share in FII driven domestic equity market which is 1.7x of size of DII.
22
Total market Cap of Institutional managed equity AUM is Rs 43 trillion (33%) FII has 21% share (Rs 27tn) MOAMC has Zero Share in FII managed AUM DII has 12% share i.e. Rs 16 tn MOAMC has 2% Share in DII managed equity AUM (excluding Insurance AUM)
MOPMS market share in Industry’s Equity AUM
~8% of PMS AUM is performance
to take this proportion higher Rs bn
Higher Alternatives share in MOAMC AUM
*Alternatives includes PMS and AIF
84.6% 15.4% PMS Industry AUM (Rs 1019 bn) MO PMS (Rs 157 bn AUM) 12% 50% 21% 17%
Market cap (132 tn) proportion
DII Promoter FII Retail 24 51 93 71 173 37 54 105 80 157 5 4 20 FY15 FY16 FY17 9M FY17 9M FY18 MF AUM PMS AUM AIF AUM 61 105 203 155 350 50% 50% Alternatives share in MOAMC AUM Mutual Fund share in MOAMC AUM
Share of performance linked AUM in Alternatives Share of Direct sales in MF net sales Operating leverage playing out as cost stabilizes & AUM rises
23 MOAMC profitability trend
31% 69% Share of Direct in MF net sales Share of Regular in MF net sales 52 264 498 768 404% 88% 139% FY15 FY16 FY17 9MFY18 PAT (Rs mn) Growth YoY % 17% 83% Alternatives AUM - Performace linked Alternatives AUM - Fixed fee 6.9% 19.6% 22.4% 26.3% 0.7% 0.5% 0.4% 0.3% FY15 FY16 FY17 9MFY18 EBITDA Margin (%)
Rising share of Alternatives in Industry AUM India still at nascent stage in Alternatives penetration 24
0% 0% 0% 0% 1% 1% 2% 5% 5% 4% 4% 6% 7% 7% FY11 FY12 FY13 FY14 FY15 FY16 FY17 Non Commodity ETF PMS + AIF
Alternatives India US PMS ~8% of MF market ~10% of MF market AIF ~2% of MF market ~30% of MF market US markets data shows that for every $100 in traditional fund products, there is $40 in AIFs and PMS and traditional AMCs may or may not participate in the space; MOAMC has been a PMS and AIF player at early stage, while Indian AMCs are yet to realise this potential
Source: AMFI, McKinsey
Rising MF Equity AUM (Rs bn) Rising share of Alternatives in Industry AUM
1,795 1,128 2,067 2,045 1,902 1,807 1,995 3,583 4,060 5,859 8,548 FY08 FY09 FY10 FY11 FY12 FY13 FY14 FY15 FY16 FY17 9MFY18 MF Equity AUM (Rs bn) 430 380 870 1019 7% 5% 8% 8% CY10 CY13 CY16 CY17 YTD Discretionary PMS AUM-Retail & Corporate (Rs bn) Discretionary PMS AUM as % of total MF AUM
40 42 48 55 66 5 6 9 12 19 FY14 FY15 FY16 FY17 Q3FY18 No of Folios (in Mn) No of SIP Acs (in Mn)
SIP gaining share in rising Equity AUM Strong traction in SIP flows continues
Source: AMFI
Investor A/Cs (Mn) in MF industry took off since mid-2014 25 Rising share of Direct proportion in Asset management industry
35% 34% 39% 43% 35% 37% 42% 43% 8% 11% 15% 16% FY14 FY15 FY16 FY17
Direct Share (As a % of total AUM) Direct Share (As a % of Debt AUM) Direct Share in HNI (As a % of Equity AUM)
52 92 118 143 145 205 317 439 18
3
744 839 887 FY10 FY11 FY12 FY13 FY14 FY15 FY16 FY17 SIP flows (Rs bn) Flows in Equity MF (Rs bn) 31.2 31.9 33.1 33.3 35.0 37.0 34.3 38.8 39.7 41.0 40.5 43.4 42.7 45.8 47.4 49.5 52.1 55.2 56.2 58.9 62.2 Apr-16 May-16 Jun-16 Jul-16 Aug-16 Sep-16 Oct-16 Nov-16 Dec-16 Jan-17 Feb-17 Mar-17 Apr-17 May-17 Jun-17 Jul-17 Aug-17 Sep-17 Oct-17 Nov-17 Dec-17 SIP Flow (Rs bn)
Post Demon
Strong traction in MF inflows (growth YoY %) Shift of financial savings from ULIP to Equity MF
Source: AMFI, IRDA, RBI, World bank
MF Equity AUM / GDP – Headroom for growth 26
0% 10% 20% 30% 40% 50% 60% 70% 80% 90% 100% FY03 FY04 FY05 FY06 FY07 FY08 FY09 FY10 FY11 FY12 FY13 FY14 FY15 FY16 FY17 ULIP AUM Equity AUM 18% 16% 12% 10% 12% 9% 8% 12% 25% 15% 10% 21% 20% 75% 30% 156% FY10 FY11 FY12 FY13 FY14 FY15 FY16 FY17 Deposits 1st yr insurance premiums MF inflows
MF is the most underpenetrated savings instrument
31% 29% 10% 4% 2% Savings deposit Life Insurance Policies Term Deposits Mutual fund (Retail) DMAT Accounts 56% 50% 26% 24% 13% 8% 12% 4% 3% 3% 1% 1% USA Australia UK Switzerland France Germany South Africa Korea Taiwan India Mexico China
Growth PE Funds
5.4x MoC (Multiple of Cost). Till date, 3.3x MoC has been returned for INR investors and 2.2x for USD investors.
and exits from fund will contribute going forward.
size of Rs 20 bn. The fund has already raised of Rs 14.7 bn and is expected to achieve targeted size of Rs 20 bn by Q4FY18. Fund III has already made its maiden investment amounting to Rs 1.4 bn in September 2017. Real Estate Funds
capital to investors. Total AUM of PE business stands at Rs ~47 bn Phenomenal response to IBEF III launch IBEF I exits could result in lumpy gains in FY18-FY19
27 Particulars (Rs mn) Q3FY18 Q3FY17 YoY (%) Q2FY18 QoQ (%) 9MFY18 9MFY17 YoY (%) FY17 Total Revenues* 168 100 69% 879
1,156 1,136 2% 1,193 EBITDA 55 40 37% 547
648 601 8% 649 PBT 51 35 45% 543
635 594 7% 637 PAT 48 22 115% 422
499 473 6% 502
* Q3FY18 includes share of profits on exit of IBEF I of Rs 250 mn, which is included in MOFSL (aforesaid in Q2FY18 was Rs 730 mn and Rs 110 mn included in MOFSL).
Launch period of PE Funds Exit period of PE funds
IBEF I (Rs 5.5 bn) IBEF II Rs 9.5 bn IREF II Rs 4.9 bn IREF III Rs 10.3 bn IBEF III Rs 20 bn FY07 FY12 FY14 FY17 FY18 IBEF I IBEF I IBEF I & IREF II IBEF I & IREF II FY16 FY17 FY18 FY19 FY20 till FY30 IBEF II & III, IREF II & III IBEF I exits delivering 5x return QGLP investments delivering higher IRR 28
450 200 500 400 400 480 400 400 12% 13% 26% 29% 30% 33% 37% 61%
Electro Mech Systems Time Technoplast Parag Milk foods Power Mech Projects Minda Industries
Foods Dixon Technologies AU Financiers
Investment Amt(Rs Mn) IRR (%) 1.3x 0.9x 1.2x 1.4x 1.9x 2.1x 2.2x 2.8x 3.5x 5.4x Year 1 Year 2 Year 3 Year 4 Year 5 Year 6 Year 7 Year 8 Year 9 Year 10
Note : * Benchmark : Emerging Markets PE and VC (upper quartile)
higher expenses on account of aggressive RM addition and higher bonus provisioning in Q3FY18.
and drive further operating leverage.
Highest-ever Net Sales at ~Rs 10 bn, +141% YoY Wealth AUM Rs 153 bn in Q3FY18, +67% YoY Rising Number of Client Families, +47% YoY
Deepening our client wallet-share & RM productivity 29 Particulars (Rs mn) Q3FY18 Q3FY17 YoY (%) Q2FY18 QoQ (%) 9MFY18 9MFY17 YoY (%) FY17 AUM (bn) 153 91 67% 129 18% 153 91 67% 101 Net adds (bn) 10 4 141% 9 14% 23 14 64% 18 Total Revenues 248 150 65% 267
694 478 45% 720 Total Cost 170 101 69% 156 9% 447 341 31% 498 C/I ratio 68% 67%
71%
EBITDA 78 49 58% 111
248 137 80% 223 EBITDA Margin 32% 33%
29%
PBT 75 48 57% 109
241 122 98% 205 PAT 53 31 71% 78
172 81 112% 132
Wealth RM productivity Wealth RM addition in proportion to AUM Wealth EBITDA margin and cost to income ratio Wealth net sales (Rs bn) 30
42 64 101 91 153 49 77 78 78 106 FY15 FY16 FY17 9MFY17 9MFY18 WM AUM (Rs Bn) WM Sales RM 6.1 5.8 9.2 6.1 6.6 0.9 0.8 1.3 1.2 1.4 FY15 FY16 FY17 9MFY17 9MFY18 Revenue/ RM (Rs mn) AUM/ RM (Rs bn) 11 15 18 14 23 FY15 FY16 FY17 9MFY17 9MFY18 33% 31% 31% 36% 67% 69% 69% 64% FY15 FY16 FY17 9MFY18 EBITDA Margin Cost to income
31
Mix change towards MF Robust yield led by equity products Aggressive RM addition (added 28 RMs) Particulars FY15 FY16 FY17 9MFY17 9MFY18 AUM (Rs bn) 42.4 64.4 101.0 91.4 152.8 Avg AUM (Rs bn) 33.3 53.4 82.7 77.9 115.1 Yield Tree (bps)* Net Yield 126 89 87 81 81 Cost 98 69 62 60 56 PBT 28 20 25 21 25 Tax 9 7 9 7 7 PAT 19 13 16 14 18 Particulars FY15 FY16 FY17 9MFY17 9MFY18 AUM (Rs bn) 61.0 104.8 203.0 155.1 350.2 Avg AUM (Rs bn) 40.6 82.9 153.9 129.9 276.6 Yield Tree (bps)* Net Yield 117 81 94 88 92 Cost 104 38 45 38 35 PBT 13 43 49 50 57 Tax 11 17 17 20 PAT 13 32 32 33 37 Rise in RM Productivity in line with rising vintage
* Annualised
113% growth in Avg AUM 48% growth in Avg AUM Highest PAT yield in industry
Highest-ever quarterly revenue Strong operating leverage Robust growth in Distribution AUM
Continues to be in investment mode Dedicated collection engine is now in place Rising pool of realised and unrealised gain Cumulative post-tax XIRR: ~30% on Equity investment
Highest-ever Net Sales Significant operating leverage Strong carry income
QoQ due to lower disbursements and higher interest reversals led by increase in NPA.
increased marginally to 31% from 29% in Q2FY18. Plans to take PCR higher in coming quarters.
setting up collection organisation. Further, prolonged impact of external shocks in the economy also affected asset
headcount is up 68% QoQ to 130 officers.
affordable housing segment. Average LTV of the book is <59%; overall FOIR remains at a comfortable level of 46%. Loan book Rs 49.4 bn in Q3FY18, +48% YoY Disbursements are cautiously calibrated Asset quality deteriorates; GNPA 4.6%
Step up in provisioning; plan to continue in future 33 Particulars (Rs mn) Q3FY18 Q3FY17 YoY (%) Q2FY18 QoQ (%) 9MFY18 9MFY17 YoY (%) FY17 Loan Book (bn) 49.4 33.3 48% 48.2 3% 49.4 33.3 48% 41.4 Disbursements (bn) 2.9 3.3
6.3
12.5 14.8
24.0 Gross NPL% 4.6% 0.6% 2.8% 4.6% 0.6% 0.6% Net Interest Income (NII) 423 302 40% 563
1,412 842 68% 1,259 Other Income 78 162
224
457 617
951 Total Income 501 464 8% 788
1,869 1,458 28% 2,209 Operating Profit (PPoP) 303 299 1% 468
1,055 899 17% 1,379 PBT 10 269
345
568 821
1,257 PAT 6 174
223
371 535
Q2FY18 and Rs 3.3 bn in Q3FY17. Disbursements were calibrated, as GNPAs continued to be higher than desired levels.
total disbursements in 9MFY18.
foundation for sustainable growth.
However, in Q3FY18, it was impacted on account of QoQ decline in yield led by interest reversals.
Q3FY18, despite negligible CP contribution in funding mix.
bank loans as of December 2017. 28 banks extended credit lines and NCDs were allotted to 24 institutions as of December 2017.
Loan book and disbursement trend (Rs bn) Margins trend 34
3.6 20.9 41.7 33.3 49.4 3.6 18.2 24.0 14.8 12.5 FY15 FY16 FY17 9MFY17 9MFY18 Loan Book (Rs bn) Disbursement (Rs bn) 3.4% 3.5% 3.6% 3.4% 3.9% 13.4% 13.4% 13.4% 13.4% 13.1% 10.8% 9.8% 9.4% 9.6% 9.7% FY15 FY16 FY17 9MFY17 9MFY18 NIM (%) Yield (%) Cost of fund (%)
conservative, with Debt-Equity ratio at 5.1x.
upgradation and refurbishment of old branches resulted in a high Cost- Income ratio of ~40% in Q3FY18 and 44% in 9MFY18 versus ~36% in Q3FY17 and 38% in 9MFY17. This expansion is expected to yield results in the near future.
commenced operations a year ago.
7.7 bn, as of December 2017.
analytics and risk framework. We are also investing in digital initiatives to reduce operating costs and turnaround time, and to improve customer
collection, clients and vendors.
(prime lending institution) under PMAY by MHUPA (Ministry of Housing and Urban Poverty Alleviation)”.
Low gearing Higher opex resulting from investment mode 35
1.2 5.1 5.5 6.0 5.1 FY15 FY16 FY17 9MFY17 9MFY18 Leverage (x) 73.5% 38.0% 37.6% 38.4% 43.5% 7.9% 3.4% 2.7% 2.8% 2.4% FY15 FY16 FY17 9MFY17 9MFY18 Cost to income Ratio (%) Opex to AUM (%)
Diversified liability mix trend LTV of 59% and FOIR of 48% Balanced customer mix (%) 36
45% 55% Self employed Salaried
Higher investment in manpower and branch network
14 51 120 84 117 155 496 1051 840 1200 FY15 FY16 FY17 9MFY17 9MFY18 Branch Employees 22% 31% 38% 48% 71% 64% 60% 59% 46% 47% 47% 46% FY15 FY16 FY17 9MFY18 Rejection Rate LTV FOIR 73% 47% 42% 31% 47% 27% 53% 58% 53% 53% 0% 0% 1% 16% 0% FY15 FY16 FY17 9MFY17 9MFY18 CP NCD Term Loan
Highest-ever quarterly revenue Strong operating leverage Robust growth in Distribution AUM
Continues to be in investment mode Dedicated collection engine is now in place Rising pool of realised and unrealised gain Cumulative post-tax XIRR: ~30% on Equity investment
Highest-ever Net Sales Significant operating leverage Strong carry income
Investments in quoted equity at cost Rs 7.7 bn Unrealised gain on quoted equity investments: Rs 7 bn (not included in P/L) Investments in MO PE/RE funds (at cost): Rs 2.7 bn
MOFSL Standalone
PE exits. However, PAT was lower sequentially due to lumpy nature of profit from PE business.
earnings yet. Overall RoE is 28% excluding unrealised gains (reported) and 40% including unrealised gains.
(since inception), validating the long-term performance track record of our QGLP philosophy.
They also serve as highly liquid “resources” available for future investments in business, if required.
Rs 2 bn. 38 Particulars (Rs mn) Q3FY18 Q3FY17 YoY (%) Q2FY18 QoQ (%) 9MFY18 9MFY17 YoY (%) FY17 Total Revenues 780 192 306% 957
1,963 1,559 26% 1,763 EBITDA 723 149 385% 906
1,805 1,414 28% 1,569 PBT 633 45 1310% 798
1,501 797 88% 857 PAT 503 56 792% 625
1,177 805 46% 863
Skin in the game in AMC Unrealised gain from quoted equity investments (Rs bn) Skin in the game in PE 39
46.9 2.7 PE AUM (Rs bn) Sponsor Commitment in PE (Rs bn) 5.5 5.9 6.4 6.3 7.7 1.6 1.2 3.3 1.9 7 FY15 FY16 FY17 9MFY17 9MFY18 Quoted investment at cost (Rs bn) Unrealised gain (Rs bn) 350.2 26.6 AMC AUM (Rs bn) Sponsor & Promoter AUM in AMC (Rs bn)
40
177.8 263.3 320.7 215.9 399.5 22.7 51.9 57.2 37.9 97.0 11.0 14.7 17.8 14.1 23.1 2.1 6.9 15.9 8.7 23.8 FY15 FY16 FY17 9MFY17 9MFY18
Advertisement expenditure (Rs mn) AMC net sales (Rs bn) Wealth net sales (Rs bn) Distribution net sales (Rs bn)
Proportion of retail volumes has increased in Q3FY18 Market ADTO is on a high in Q3FY18 (Rs bn)
Source: NSE and BSE
Proportion of NSE cash volumes consolidated to the largest brokers during bull-phases in the markets, not bear-periods 42
65 61 81 70 87 106 149 141 166 158 218 249 513 502 626 618 764 788 2,614 2,304 3,195 3,475 5,561 5,806
FY15 FY16 FY17 Q3FY17 Q2FY18 Q3FY18 Options Futures Intraday Delivery 6,629 3,340 3,007 4,068 6,950 4,321 78% 77% 79% 80% 84% 84% 15% 17% 15% 14% 12% 11% 4% 5% 4% 4% 3% 4% 2% 2% 2% 2% 1% 2% FY15 FY16 FY17 Q3FY17 Q2FY18 Q3FY18 Delivery Intraday Futures Options 46% 46% 46% 50% 50% 51% 16% 18% 18% 17% 17% 17% 37% 36% 36% 32% 32% 32% FY13 FY14 FY15 FY16 FY17 Sep'17 Top 25 Brokers Next 25 brokers Above 50
DIIs net inflows (Rs bn) As momentum in IPO activity continued, incremental Demat accounts continued to grow at a healthy pace FIIs net inflows (Rs bn) IPO raising has picked up since the last FY15
Source: NSE, BSE, CDSL, NSDL, Prime
43
804 308 353 420 275 FY15 FY16 FY17 Q3FY17 Q2FY18 Q3FY18
1,113
561
169 FY15 FY16 FY17 Q3FY17 Q2FY18 Q3FY18
21.8 23.3 25.4 24.2 28.7 29.7 1.5 2.0 2.5 2.8 1.0 1.2 FY15 FY16 FY17 Q3FY17 Q2 FY18 Q3 FY18 Existing Accounts (Mn) New Accounts (Mn) 42 73 106 17 63 41 30 145 291 72 198 365 FY15 FY16 FY17 Q3FY17 Q2FY18 Q3FY18 IPO Count IPO Amount (Rs Bn)
Higher financial savings signifying opportunity for MFs Equity assets of households are rising in recent years Low penetration of MFs provides headroom for growth
MF penetration (AUM/GDP%); Global AUM ($Tn)
Source: RBI, Bloomberg, IIFA Report
Equities are underpenetrated within Indian financial savings
44
46% 46% 44% 46% 48% 43% 48% 49% 52% 43% 48% 44% 32% 33% 37% 37% 42% 46%
FY00 FY01 FY02 FY03 FY04 FY05 FY06 FY07 FY08 FY09 FY10 FY11 FY12 FY13 FY14 FY15 FY16 FY17
(% of household savings)
9% 11% 30% 36% 46% 54% 55% 50% 59% 80% 104% 0% 20% 40% 60% 80% 100% 120%
India China Korea Japan SA UK World Brazil Germany France USA
US$
19 1.4 41 1.0 2.0 1.9 0.1 1.5 0.4 1.3 0.2 64% 40% 10%
4% Deposits Insurance & PPFs Equity Currency Others 5% 7% 0% 3% 0% 1% 1% 2% 2% 4% 7% FY07 FY08 FY09 FY10 FY11 FY12 FY13 FY14 FY15 FY16 FY17 (% of household assets)
Significant inflows in Eq MF AUM in last up-cycle (FY02-08 ); same traction has been witnessed from FY14 onwards (Rs tn)
Investor A/Cs (Mn) in MF industry took off since mid-2014 Market performance drives MF net flows, a repeat of the last cycle (Rs bn) Proportion of Equity in Industry MF AUM mix went up in 5 years
Source: AMFI
45
0.2 0.1 0.3 0.4 1.0 1.2 1.7 1.1 2.1 2.0 1.9 1.8 2.0 3.6 4.1 5.9 8.5 FY02 FY03 FY04 FY05 FY06 FY07 FY08 FY09 FY10 FY11 FY12 FY13 FY14 FY15 FY16 FY17 Dec-17
5 72 71 352 282 469 40 17 -125 3 -145
759 839 887 1,679 FY02 FY03 FY04 FY05 FY06 FY07 FY08 FY09 FY10 FY11 FY12 FY13 FY14 FY15 FY16 FY17 Dec-17 48 48 48 47 47 47 47 45 43 41 40 40 40 42 43 44 46 48 49 51 53 55 58 62 66 Mar-09 Sep-09 Mar-10 Sep-10 Mar-11 Sep-11 Mar-12 Sep-12 Mar-13 Sep-13 Mar-14 Sep-14 Dec-14 Mar-15 Jun-15 Sep-15 Dec-15 Mar-16 Jun -16 Sep-16 Dec-16 Mar-17 Jun-17 Sep-17 Dec-17
25% 23% 32% 31% 31% 36% 0% 1% 1% 1% 3% 3% 56% 56% 48% 46% 42% 38% 13% 16% 15% 16% 18% 13% 2% 2% 2% 3% 5% 8%
3% 2% 2% 2% 1% 1% FY13 FY14 FY15 FY16 FY17 Dec-17
Others Balanced Liquid/Money Market Debt Oriented ETFs(other than Gold) Equity Oriented
India is Home to ~0.2 mn HNIs, out of which ~0.15 mn are UHNIs; UHNI growth and count has seen steady growth last 6 years Individual Wealth distribution shows India has a higher share of Alternates, but lower share of Equity, to global averages
Source: AMFI, Kotak Top of Pyramid Report, arvy Wealth report, 2016
HNI’s Mutual Funds AUM grew at 25% CAGR in the last 4 years (Rs bn); Folios grew at 32% CAGR (Mn) HNI’s equity Mutual Funds AUM have picked up at a higher CAGR of 50% in the last 4 years (Rs bn) 46
62.0 81.0 100.9 117.0 137.1 146.6 45 65 86 104 128 135 FY11 FY12 FY13 FY14 FY15 FY16 UHNI Count ('000) UHNI Net worth (Rs mn) 337 408 1,048 1,232 1,743 2,604 FY13 FY14 FY15 FY16 FY17 Dec-17 1,936 2,256 3,097 3,528 4,762 6,306 0.9 1.1 1.4 1.8 2.5 3.5 FY13 FY14 FY15 FY16 FY17 Dec-17 AUM (in Bn) No of Folios (in Mn) 31 17 45 42 10 25 14 18 Global India Real estate Alternate Assets (including gold and other precious metals) Debt (including cash) Equity
Source: ICRA, World Bank, RBI
Small HFCs outpaced large HFCs (Rs tn) Indian mortgage underpenetrated versus Asian peers (Mortgage to GDP) HFCs gaining share from banks India’s housing credit growing significantly (Rs tn)
10% 17% 20% 26% 29% 32% 39% 48% 81% 88% India Thailand China Korea Malaysia Singapore Taiwan Germany UK USA
47
1.3 1.7 2.1 2.6 3.1 3.8 4.5 5.4 3.2 3.8 4.2 4.8 5.7 6.6 7.9 9.1
FY10 FY11 FY12 FY13 FY14 FY15 FY16 FY17
HFC Banks Housing Credit CAGR: 18% Banks Housing Credit CAGR: 16% HFCs Housing Credit CAGR: 22% 4.5 8.8 10.4 7.4 6.3 5.5 13.7 14.4 30% 31% 33% 35% 35% 36% 37% 37% 70% 69% 67% 65% 65% 64% 63% 63% FY10 FY11 FY12 FY13 FY14 FY15 FY16 FY17 % of HFC % of Banks 0.3 0.3 0.4 0.5 0.7 1.0 1.2 1.4 1.7 2.2 2.6 3.1 3.6 4.1 FY11 FY12 FY13 FY14 FY15 FY16 FY17 Small HFCs Other HFCs All HFCs Housing-Portfolio CAGR: 21% Small HFCs Housing- Portfolio CAGR: 30% Other HFCs Housing- Portfolio CAGR: 19% 1.7 5.0 3.8 4.5 3.1 2.6 2.1
Note : * Includes only retail mortgages; does not include LAP and Construction Finance
Source: RBI, MHUPA, Knight Frank
Affordable Housing gaining traction Affordable Housing opportunity – Shortage of urban & rural housing Priority Sector Housing credit trend (Rs bn) Housing credit trend (Rs bn) 48
15 18 19 21 22 19 34 34 30 27 26 22 15 2001 2005 2008 2010 2014 2015 2022E Urban Shortage (Nos in Mn) Rural Shortage (Nos in Mn) 4,407 4,567 4,785 5,037 5,147 5,386 5,614 5,787 5,987 6,285 6,534 6,829 7,140 7,468 7,734 8,058 8,197 8,601 8,619 9,086 9,221 13% 13% 17% 20% 17% 18% 17% 15% 16% 17% 16% 18% 19% 19% 18% 18% 15% 15% 11% 13% 12% Dec-12 Mar-13 Jun-13 Sep-13 Dec-13 Mar-14 Jun-14 Sep-14 Dec-14 Mar-15 Jun-15 Sep-15 Dec-15 Mar-16 Jun-16 Sep-16 Dec-16 Mar-17 Jun-17 Sep-17 Dec-17 Housing (Including Priority Sector Housing) YoY%
(Rs Bn) (%)
2,593 2,672 2,855 2,895 2,939 3,020 3,078 3,168 3,187 3,224 3,208 3,317 3,387 3,423 3,473 3,585 3,575 3,683 3,571 3,688 3,701 3% 1% 12% 15% 13% 13% 8% 9% 8% 7% 4% 5% 6% 6% 8% 8% 6% 9% 4% 6% 3% Dec-12 Mar-13 Jun-13 Sep-13 Dec-13 Mar-14 Jun-14 Sep-14 Dec-14 Mar-15 Jun-15 Sep-15 Dec-15 Mar-16 Jun-16 Sep-16 Dec-16 Mar-17 Jun-17 Sep-17 Dec-17 Housing (Priority Sector) YoY%
(Rs Bn) (%)
0% 5% 10% 15% 20% 25% 30% 35% 40% 45% < 2.5 Mn 2.5 - 5 Mn 5 - 7.5 Mn 7.5 - 10 Mn > 10 Mn CY16 CY17
This earning presentation may contain certain words or phrases that are forward - looking statements. These forward-looking statements are tentative, based on current analysis and anticipation of the management of MOFSL. Actual results may vary from the forward-looking statements contained in this presentations due to various risks and uncertainties involved. These risks and uncertainties include volatility in the securities market, economic and political conditions, new regulations, government policies and volatility in interest rates that may impact the businesses of MOFSL. MOFSL has got all market data and information from sources believed to be reliable or from its internal analysis estimates, although its accuracy can not be guaranteed. MOFSL undertakes no obligation to update forward-looking statements to reflect events or circumstances after the date thereof. Disclaimer: This report is for information purposes only and does not construe to be any investment, legal or taxation advice. It is not intended as an
your responsibility alone and MOFSL and its subsidiaries or its employees or directors, associates will not be liable in any manner for the consequences of such action taken by you. We have exercised due diligence in checking the correctness and authenticity of the information contained herein, but do not represent that it is accurate or complete. MOFSL or any of its subsidiaries or associates or employees shall not be in any way responsible for any loss or damage that may arise to any person from any inadvertent error in the information contained in this publication. The recipient of this report should rely on their own investigations. MOFSL and/or its subsidiaries and/or directors, employees or associates may have interests or positions, financial or otherwise in the securities mentioned in this report. 49