
SLIDE 1
Monitoring and Analysis at ALCF Kevin Harms harms@alcf.anl.gov - - PowerPoint PPT Presentation
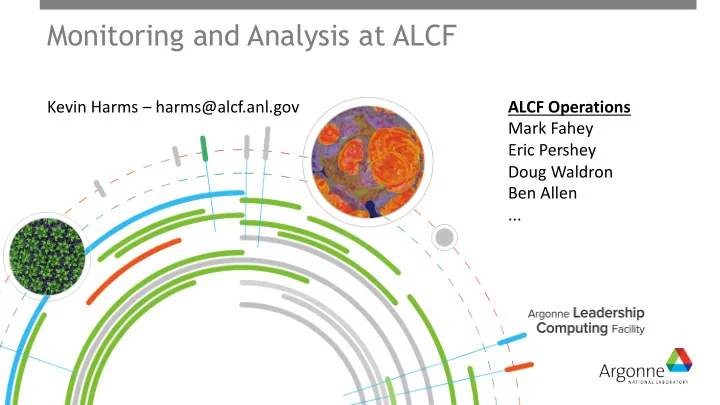
Monitoring and Analysis at ALCF Kevin Harms harms@alcf.anl.gov ALCF Operations Mark Fahey Eric Pershey Doug Waldron Ben Allen ... ALCF Philosophy Collect all data and store (ETL) into central location (data warehouse) Sometimes
¤ Collect all data and store (ETL) into central location (data warehouse)
¥ Sometimes data is reduced or summarized ¥ Raw data is retained ¥ Not all data that is collected as an associated analysis or monitor ¥ Approach facilitates ad-hoc analysis by any staff after the fact
¡
Discover useful analyses as we go
¤ Focus primarily on monitoring for internal staff
¥ Augmenting and improving this is a continuous goal
¤ Limited data provided for users
¥ Improving this is a long term goal
2
Analysis1 Analysis2 Analysis3
¤ Job Failure Analysis (JFA)
¥ Establish root cause for any job failure (non-zero) exit code ¥ Combination of automatic processing of “business” logic with human-in-the-
¥ Generates “failure” records ¥ Find areas improvement at a system level
¤ Operational Data Processing System (ODPS)
¥ Produces various system wide metrics ¥ Availability, MTTI, utilization, etc.
¤ Machine Time Overlay (MTO)
¥ Graph node allocations over time on 2-d grid with annotations of events or
¤ Darshan (I/O monitoring) ¤ XALT (library tracking)
3
Transforms monitoring data from across the data center into answers to answer "why is my I/O slow?"
https://www.nersc.gov/research-and-development/tokio/ https://www.github.com/nersc/pytokio
¤ BG/Q Control System ¤ ALPS Logs ¤ HSSdb (Cray hardware supervisory system) ¤ Scheduler logs (job, reservations) ¤ File system logs (GPFS, Lustre) ¤ Accounting (sbank) ¤ Job Logs (standard output,error,info) ¤ Theta control system logs (boot log, etc.) ¤ Job instrumentation (Darshan, AutoPerf, ..) ¤ Future
¥ LDMS?
5
6
7
8
¤ Y axis are the
¤ X axis is time
¤ Analyze scheduling performance and behavior ¤ Any information such as data, location, time can be displayed this
¥
coolant temperature, power consumption, etc..
10
11
12