SLIDE 38 20 40 60 80 100 120 140 2005 2010 2015 2020 2025 2030 2035 2040 20452050
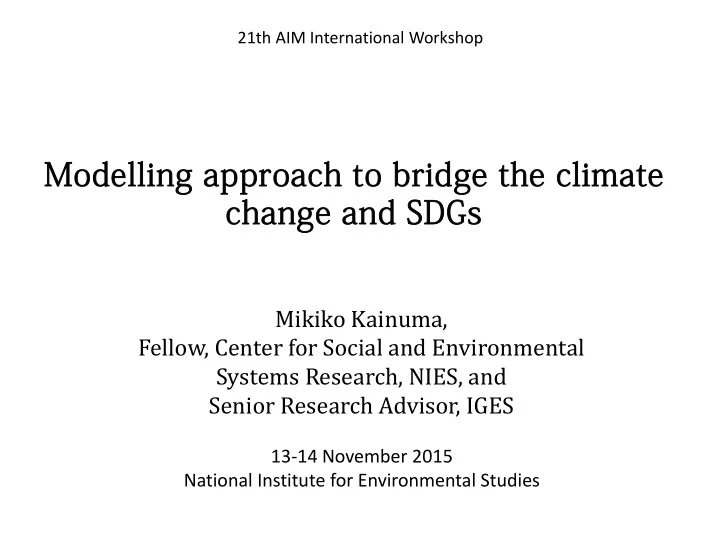
SO2 emissions in Asia(Mt SO2)
20 40 60 80 100 120 2005 2010 2015 2020 2025 2030 2035 2040 2045 2050
NOx emissions in Asia(Mt NOx)
Reference T50 T100 T200 T400 2 ℃ 2.5 ℃ 3 ℃ 5 10 15 20 25 2005 2010 2015 2020 2025 2030 2035 2040 2045 2050
BC emissions in Asia(Mt BC)
5 10 15 20 25 30 35 40 2005 2010 2015 2020 2025 2030 2035 2040 2045 2050
PM emissions in Asia(Mt PM)
Reference T50 T100 T200 T400 2 ℃ 2.5 ℃ 3 ℃
38
Reference 50US$/tCO2 100US$/tCO2 200US$/tCO2 400US$/tCO2 2 ℃ scenario 2.5 ℃ scenario 3℃ scenario
Source) modified from Hanaoka et al, Environmental Pollution (2014)
There are large reduction potentials of air pollutants and SLCPs, due to GHG mitigation actions such as drastic fuel sifts and energy efficiency improvement.
(e.g. 60~90% reductions compared to baseline in 2050
Output examples SLCP & Air pollutants emissions in Asia
- Cobenefits of implementing CO2 mitigation policies-