Mi Missi ssissi ssippi i Phosp osphates s Corp Corpor orati - - PowerPoint PPT Presentation

mi missi ssissi ssippi i phosp osphates s corp corpor
SMART_READER_LITE
LIVE PREVIEW

Mi Missi ssissi ssippi i Phosp osphates s Corp Corpor orati - - PowerPoint PPT Presentation

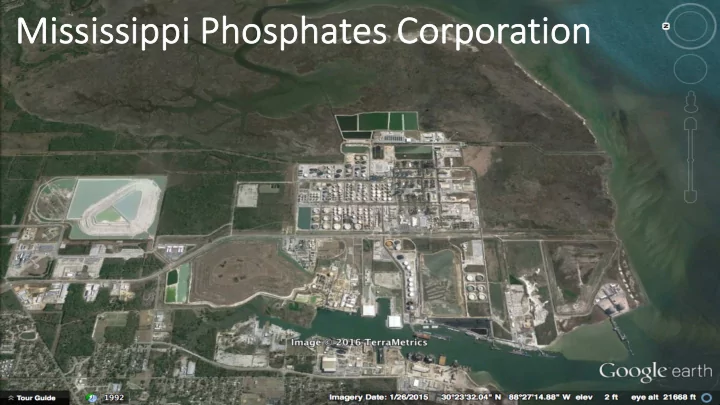
Mi Missi ssissi ssippi i Phosp osphates s Corp Corpor orati tion on Mississippi Phosphates Corporation Bayou Casotte / Gulf of Mexico Pascagoula, Mississippi GrandBayWildlife ManagementArea MPC Site GrandBayNational EstuaryResearch


slide-1
SLIDE 1

Mi Missi ssissi ssippi i Phosp

  • sphates

s Corp Corpor

  • rati

tion

  • n
slide-2
SLIDE 2

Mississippi Phosphates Corporation Bayou Casotte / Gulf of Mexico Pascagoula, Mississippi

slide-3
SLIDE 3

GrandBayWildlife ManagementArea

MPC Site

GrandBayNational EstuaryResearch Reserve

Chevron BayouCasotte Refinery

Gulf of Mexico

slide-4
SLIDE 4
slide-5
SLIDE 5

Diammonium Phosphate Fertilizer Process – Step 1

Sulfuric Acid Phosphate Rock Phosphate Rock + Sulfuric Acid • Phosphoric Acid Waste water from this step goes to the “Gypstack” complex

slide-6
SLIDE 6

Diam Diammoniu ium P Phosphate ( (DAP) P Proce cess s – – St Step 2 2

a) Ammonia + Phosphoric Acid • DAP Wastewater Treatment Plant ~1.2 MGD (excess wastewater) b) Dry and pelletize c) Load and ship

Waste water from this step goes to the “Gypstack” complex

slide-7
SLIDE 7

Sense of Scale

P6 P5 P4 P3

East Gypstack and Ponds

Potomac Yard South

slide-8
SLIDE 8

Sense of Scale

Two men

slide-9
SLIDE 9
slide-10
SLIDE 10

Stakeholder Concerns

slide-11
SLIDE 11

St Step 2: F 2: Faci cility T Tou

  • ur a

r and F Findings s – – Be Berm rm Er Erosi sion n

slide-12
SLIDE 12

Fa Facility y Tour r Findings s – – Sl Slou

  • ughing

g

slide-13
SLIDE 13

Fa Facility y Tour r Findings s – – Si Sidewall Se Seeps s

Note step in benches for a later discussion

slide-14
SLIDE 14

Fa Facility y Tour r Findings s – – Inadequa Inadequate e Fr Freebo eeboar ard d

slide-15
SLIDE 15

Fa Facility y Tour r Findings s – – In Inadeq equate e Water er Trea eatmen ment C t Capacity y

1.1 MGD x 365 days = 401 million gal/yr (assumes no significant downtime) 1” of rain adds ~9,000,000 of contact water

  • Ave. year precipitation = 64 inches
  • Ave. evaporation = 22 inches

Net add = 42” x 9 MG = 378 million gallons “Cost of rain” in an average year = ~$5 million

slide-16
SLIDE 16

Recommendations

Immediate:

  • Repair and maintain berms
  • Reduce water levels to attain adequate freeboard
  • Increase water treatment capacity
  • Maintain high-level management visibility and support

Longer term:

  • Reduce contact water footprint to reduce “cost of rain”
slide-17
SLIDE 17

Israeli Chemicals Fertilizer Plant (June 2017)

  • Partial collapse of

150-foot-high wall

  • Released 26.4 million

gallons of highly acidic wastewater in the Ashalim riverbed

  • Wake of ecological

destruction more than 12 miles long

slide-18
SLIDE 18

Au August t 2017 7

Collapse of step in benches due to saturation and erosion 100+ gpm running seeps Immediate Action:

  • High-level management

alert

  • Ponds 2 & 3

immediately lowered and taken out of service

slide-19
SLIDE 19

Em Emergenc ncy y By-Pa Pass s Operations s (2017) )

  • Dikes, berms & ponds of East Gyp Stack had

structural integrity issues

  • Overtopping/desiccation/piping, etc.
  • Confirmed by multiple ERT inspections
  • By-passes managed by EPA
  • pH neutralization only with sodium hydroxide
  • ≈ 400 MGs over 5 events were by-passed between July

and October 2017 to prevent uncontrolled releases from Ponds 3 and 4 on top of stack

  • Treatment costs per gallon = $0.015727
  • Closely monitored to prevent eutrophication and algal

blooms

  • No adverse impacts observed
slide-20
SLIDE 20

Closure Concepts

slide-21
SLIDE 21

BEFORE AFTER

slide-22
SLIDE 22

BEFORE AFTER

slide-23
SLIDE 23

Contacts

Craig Zeller, P.E. - EPA Remedial Project Manager

Zeller.Craig@epa.gov 404.562.8827 (cell) Tom Kady – EPA Environmental Response Team Kady.Thomas@epa.gov 732.735.5822