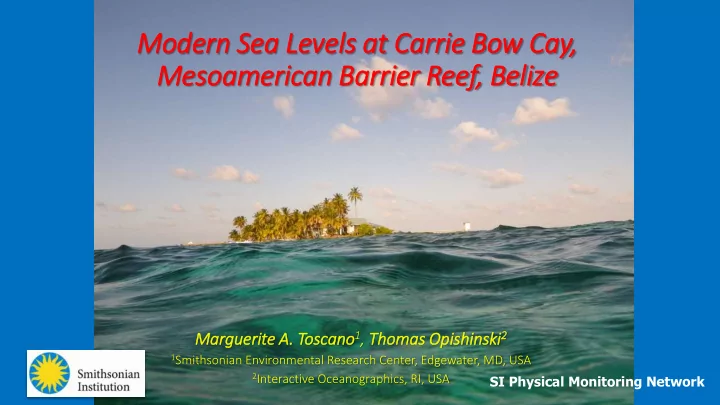

Modern Sea Levels ls at Carrie Bow Cay, Mesoamerican Barrier Reef, Beli lize oscano 1 , Thomas Opi inski 2 Mar argueri rite A. A. Tos pish shin 1 Smithsonian Environmental Research Center, Edgewater, MD, USA 2 Interactive Oceanographics, RI, USA SI Physical Monitoring Network
Modern sea levels at Carr rrie Bow Cay, , Belize Tide gauge 2000-2014 Tide Station 2015 Operated by the Smithsonian Marine Station at Fort Pierce FL (NMNH) Caribbean Coral Reefs Ecosystem (CCRE) Program, est. 1972 15 miles offshore on the Mesoamerican Barrier Reef http://www.ccre.si.edu/
2015- 2016 Radar Tide Gauge New Instrument Platform Pressure Sensor Tide Gauge
Small Platform, 90 m from benchmark, =“ Xtreme ” surveying, leveling Geodetic network now includes a platform benchmark No room for GPS tripod – Gorilla Tape + bipods! Barely any room to level tide gauges to benchmark Leveling Radar in choppy water = 4mm closure error!
Legacy Sonde data analysis
Platform Radar/PS data – IO IOC since 2015
Tidal Statistics for CARRIE BOW CAY RADAR Port details: TASK Analysis: 102 HCs ; Start: 19/04/2016 (000001) ; End: 27/02/2018 (163094) Datum of Predictions = Chart Datum Highest observed water level Mean Higher High Water Highest Astronomical Tide (HAT): 2.82 metres Mean High Water Diurnal High Water Inequality Lowest Astronomical Tide (LAT): 2.33 metres Diurnal Range of Tide Maximum Tidal Range possible: 0.33 metres Diurnal Tide Level Mean Tide Level Mean High Water Spring (MHWS): 2.66 metres Mean Sea Level Mean Range of Tide Mean High Water Neap (MHWN): 2.62 metres Mean Low Water Mean Low Water Neap (MLWN): 2.54 metres Diurnal Low Water Inequality Mean Lower Low Water Mean Low Water Spring (MLWS): 2.49 metres Lowest observed water level Tide Type: 0.54 (mixed - mainly semi-diurnal) Shallow Water Influence: 0.02 Note: all numerical values in meters, except for HWI and LWI (which are in units of hours) Selected Period: 01/01/2018 to 31/12/2018 Computed from 5-months of tabulated observations: Highest Tide in this period: 2.80 metres January thru May 2003 Lowest Tide in this period: 2.33 metres Source; CO-OPS 11/19/2012
TASK Plot – Jan 2018 Tsunami detection:
Thankful for: Tide Tables – an exciting development for fi field research! Still Need: • CSV or text file containing date-time, observed tide, predicted tide, residuals; • Need to create other graphics for publications and field station websites; • Need to compute other indices such as rate of SLR
Acknowledgements SI Consortium for Understanding and Sustaining a Biodiverse Planet National Park Service – NSF 0921879 (Toscano) Study No. BISC-00013, Belize, Biscayne Biscayne NP; U Miami, Broad Key Research Station Smithsonian Caribbean Coral Reefs Ecosystem Program Belize Halliburton Foundation Smithsonian MarineGEO Panama National Geodetic Survey; CO-OPS
Recommend
More recommend