
SLIDE 1
Measuring NIR Extinction with GPS
Cullen Blake & Margaret Shaw Princeton University
0.5 1.0 1.5 2.0 2.5 Wavelength (µm) 0.0 0.2 0.4 0.6 0.8 1.0 Transmission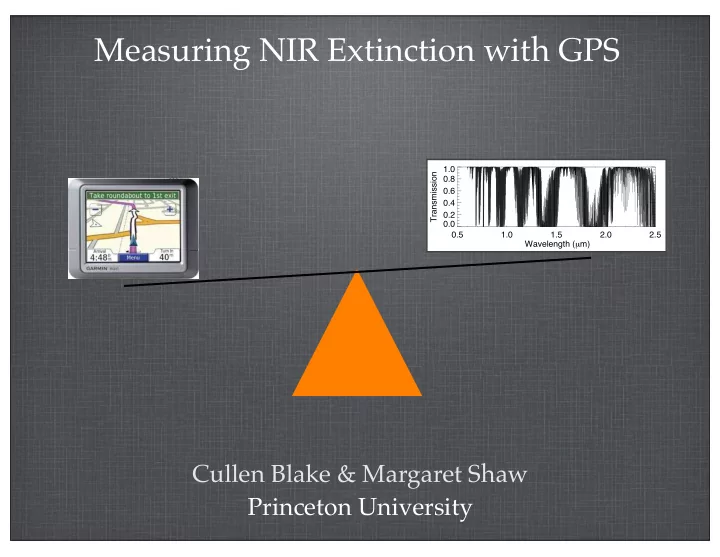
Measuring NIR Extinction with GPS 1.0 Transmission 0.8 0.6 0.4 - - PowerPoint PPT Presentation
Measuring NIR Extinction with GPS 1.0 Transmission 0.8 0.6 0.4 0.2 0.0 0.5 1.0 1.5 2.0 2.5 Wavelength ( m) Cullen Blake & Margaret Shaw Princeton University Water, Water Everywhere! 1.0 0.8 Transmission 0.6 0.4 0.2 0.0
Measuring NIR Extinction with GPS
Cullen Blake & Margaret Shaw Princeton University
0.5 1.0 1.5 2.0 2.5 Wavelength (µm) 0.0 0.2 0.4 0.6 0.8 1.0 Transmission 1.6 1.8 2.0 2.2 2.4 Microns 0.0 0.2 0.4 0.6 0.8 1.0 Transmission 0.6 0.8 1.0 1.2 1.4 Microns 0.0 0.2 0.4 0.6 0.8 1.0 Transmission
Water, Water Everywhere!
Typical Transmission: Apache Point Observatory
0.0 0.2 0.4 0.6 0.8 1.0 1.2 Flux !=1.1% 0.974 0.976 0.978 0.980 0.982 0.984 Wavelength (µm)
0.0 0.2 0.4 0.6 0.8 1.0 1.2 Flux !=1.8%
Two Echelle Spectra of an A Star Same Airmass, 300% Change in Optical Depth
Water Absorption: Highly Variable
Water Lines
2 4 6 8 10 PWV (mm)
0.00 0.02 0.04 0.06 zraw (%)
0.0 2.0 4.0 6.0 8.0 10.0
% Change in Raw z Band Flux
Change In Uncalibrated Flux: Repeat SDSS z Band Observations of F Stars
Broadband NIR Photometry
PWV = Precipitable Water Vapor
X X X X
dλ Differential Photometry
Earth Atmosphere Filter Detector Source SED Telescope
Detected Photons = X X ~ Constant Assumptions
1) Contemporaneous observations of both stars 2) Perfectly calibrated 2D detector 3) Small angular separation between stars 4) Stellar SEDs same across filter bandpass mmag Ground-based Differential Photometry Possible (Even in z Band)
Star A Star B
dλ dλ
Differential Photometry of Cool Stars
0.70 0.75 0.80 0.85 0.90 Microns 0.0 0.2 0.4 0.6 0.8 1.0 Transmissionx x
0.70 0.75 0.80 0.85 0.90 Microns 0.0 0.2 0.4 0.6 0.8 1.0 TransmissionM Star A Star
≠
Low PWV High PWV
Up to 1% Effect in Differential Photometry of Cool Stars Precise Telluric Models Can Help x x
700-900nm (i+z) A Star M Star 700-900nm (i+z)
Global Positioning System
“At the beep, the time will be exactly...” 1.2 & 1.6 GHz Satellites have synchronized atomic clocks Satellite positions precisely known
GPS measures light travel time: satellites to receiver If Speed of Light (Index of Refraction) is Known: Signals From Four Satellites Get You: Absolute X,Y,Z Position of Receiver Time Offset Between Receiver Clock and Satellite Clocks
GPS Timing Delays (Fixed Receiver)
Ionospheric Delay: 10 m +/- 1 mm Frequency Dependent: Precisely Measured Using Dual Frequency GPS Data “Dry Air”: 2 m +/- 1 mm “Hydrostatic Delay” Water Vapor: 0.03 to 0.3 m “Wet Delay”
26000 km 12 km 50 km
e- e- e- e- e- e- e- e- e- e-
“Pseudo Range” 10m = 3 ns Timing Delay
Many Sources of Error Eliminated By “Double Differencing” - Network of GPS
Measurements: GPS, Temperature, Pressure
Dry Delay
Function of Position
Barometric Pressure +/- 0.3 mbar
= (mm) Wet Delay = Total Delay - (Ionospheric Delay+Dry Delay) PWV ∝ F(T) x Wet Delay
Relative PWV +/- < 0.2 mm
Calculated From Raw GPS Data Commercial Software (e.g. Bernese)
References: Bevis et al. 1992, 1994
Caveat: These are Estimated Zenith Quantities Azimuthal Symmetry Assumed
GPS Monitoring Networks
Suominet Network http://www.suominet.ucar.edu/ Ware et al. 2000
Data Processed in Real Time by Suominet Project PWV Estimates Every 30 Minutes
PWV Monitor at Apache Point
Lots of Great Work on Astronomical Applications of PWV Monitors: Talk by Kerber; Kerber 2010, Thomas-Osip 2007, Querel 2008,2011, Otarola 2011, Seifahrt 2010
PWV at Apache Point Observatory
All Measurements 3.5m Telescope Collecting Data
Water Vapor: Highly Variable
Water Vapor: Highly Variable
Histogram of Change in PWV Over 30 min Intervals Two Years of “Good” Observing Conditions at APO
10 20 30 40 50 | PWV| in 30 minutes (%) 0.0 0.2 0.4 0.6 0.8 1.0 Reltaive Frequency
0.0 0.2 0.4 0.6 0.8 1.0 1.2 Flux !=1.1% 0.974 0.976 0.978 0.980 0.982 0.984 Wavelength (µm)
0.0 0.2 0.4 0.6 0.8 1.0 1.2 Flux !=1.8%
A Star Observations
ARCES on 3.5m at APO 100 Observations Over 1 Year, R=30,000 S/N~150
Water Lines
Forward Modeling of Spectra
Theoretical Telluric Templates Custom Line-by-Line Radiative Transfer Code: + + =
0.5 1.0 1.5 2.0 2.5 Wavelength (µm) 0.0 0.2 0.4 0.6 0.8 1.0 TransmissionFitting Telluric Templates to A Star Spectra Free Parameters: Pixel-to-Wavelength Solution Spectrograph Line Spread Function Relative Water Vapor Optical Depth (τ)
Forward Modeling
Fit RMS Typically 1% for Unsaturated Lines
0.0 0.2 0.4 0.6 0.8 0.1xPWV(mm) + 0.36x(AM-1) 0.0 0.2 0.4 0.6 0.8 1.0 !
Telluric Optical Depth Scale Factor τ
GPS-based PWV vs. Observed Line Depths
Strong Correlation Between Best-fit Scale Factor and PWV Also Depends on Airmass
Blake & Shaw, 2011,PASP, 123, 1302
τ+/-0.06
Applications
Precise Telluric Models:
0.5 1.0 1.5 2.0 2.5 Wavelength (µm) 0.0 0.2 0.4 0.6 0.8 1.0 TransmissionCorrecting NIR Photometry:
X X
dλ
Earth Atmosphere Filter Source SED
No Free Parameters Match Observed (Unsaturated) Lines to ~1%
0.976 0.978 0.980 Wavelength (µm) 1 2 3 Flux + Offset ARCES Data H2O Model M Star Template
NIR Radial Velocity Measurements
Telluric Lines as a Simultaneous Absorption Reference
SDSS Photometry of Cool Stars
0.00 0.01 0.02 ! (r-z) 0.02 2 4 6 8 10 PWV (mm)
Points: Calibrated r-z Colors of SDSS M Dwarfs Relative to Stellar Locus Dashed Line: Estimate of PWV Bias Assumes SDSS Photometric Solutions Based on an F star
0.00 0.01 0.02 ! z (mag) G5-F5 2 4 6 8 10 PWV (mm)
0.00 0.01 0.02 ! z (mag) M7-M4
SDSS Photometry of Cool Stars
Calibrated Photometry of G-F and mid-M stars from Stripe 82 Important for Transiting Planet Searches Targeting M Stars
Conclusions
Text GPS-based PWV Estimates are Useful for Astronomy! These Measurements Can Be Used to Generate Excellent Telluric Templates These Templates Have Many Uses: Correct Relative Photometry of Cool Stars Radial Velocities and High-resolution NIR Spectroscopy Future: A Network of Stations to Measure 3D Water Distribution in Real Time?
0.0 0.2 0.4 0.6 0.8 1.0 1.2 Flux !=1.5% 0.930 0.932 0.934 0.936 0.938 0.940 Wavelength (µm)
0.0 0.2 0.4 0.6 0.8 1.0 1.2 Flux !=2.9%
0.000 0.005 0.010 0.015 ! Differential Flux (mag) 0.0 0.2 0.4 0.6 0.8 1.0 Relative Frequency z i+z y