Manifestations of MS Loneliness in Multiple Sclerosis: Putative - - PowerPoint PPT Presentation

manifestations of ms
SMART_READER_LITE
LIVE PREVIEW

Manifestations of MS Loneliness in Multiple Sclerosis: Putative - - PowerPoint PPT Presentation

Manifestations of MS Loneliness in Multiple Sclerosis: Putative Antecedents and Manifestations Loss of walking mobility 1 Unemployment 2 Julia M. Balto Cognitive dysfunction Loss of employment Lara A. Pilutti Robert W. Motl


slide-1
SLIDE 1

Loneliness in Multiple Sclerosis: Putative Antecedents and Manifestations

Julia M. Balto Lara A. Pilutti Robert W. Motl

  • Loss of walking mobility1
  • Cognitive dysfunction
  • Symptomatic fatigue
  • Depression
  • Unemployment2
  • Loss of employment
  • Reduced quality of life (QOL)
  • Restricted community and

social participation

1Benedict & Zivadinov, 2011, 2Krupp, n.d., 3Soderburg, 1992, p. 7

Manifestations of MS

The im pact of MS extends into “ w ork roles, econom ic status, relationships w ithin the fam ily, and relationships betw een the fam ily and the larger com m unity"3

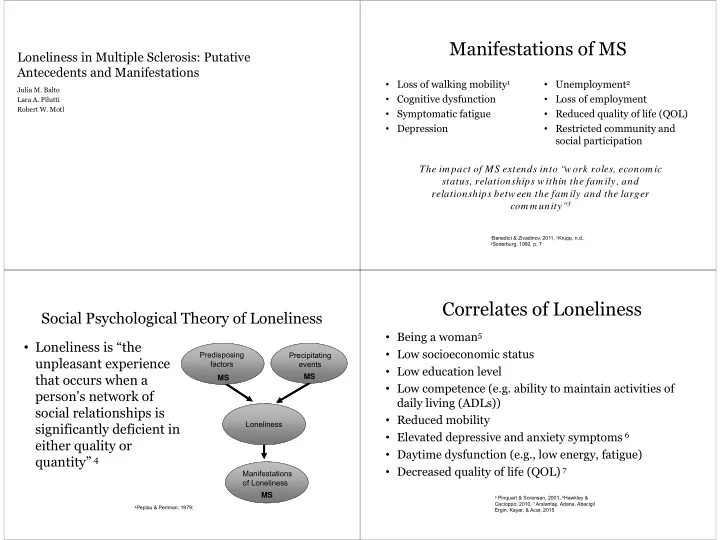
Social Psychological Theory of Loneliness

  • Loneliness is “the

unpleasant experience that occurs when a person's network of social relationships is significantly deficient in either quality or quantity” 4

4Peplau & Perlman, 1979;

Predisposing factors Precipitating events Loneliness Manifestations

  • f Loneliness

MS MS MS

Correlates of Loneliness

  • Being a woman5
  • Low socioeconomic status
  • Low education level
  • Low competence (e.g. ability to maintain activities of

daily living (ADLs))

  • Reduced mobility
  • Elevated depressive and anxiety symptoms 6
  • Daytime dysfunction (e.g., low energy, fatigue)
  • Decreased quality of life (QOL) 7

5 Pinquart & Sorensen, 2001, 6Hawkley &

Cacioppo, 2010, 7 Arslantaş, Adana, Abacigil Ergin, Kayar, & Acar, 2015

slide-2
SLIDE 2

Loneliness in MS

  • Rokach, 2004

– Cross-sectional study – Examined the qualitative aspects of loneliness in persons with MS – Loneliness measure: A 30-item study-generated measure of loneliness with unknown psychometric properties

  • Those with MS had the lowest scores on all domains of

loneliness

  • Women with MS expressed higher levels of loneliness than

men with MS in all domains.

Loneliness in MS

  • Beal & Stuifbergen, 2007

– Cross-sectional study – Examined the prevalence and correlates of loneliness in women with MS – Loneliness measure: a single item from the Center for Epidemiological Studies Depression Scale (CES-D) – 50% of the women felt lonely during the past week – Loneliness was significantly correlated with

  • social responses of illness (r=0.37)
  • social support (r=-0.37)
  • functional limitation (r=0.20)
  • self-rated health status (r=-0.25)
  • marital status (r=0.20).

Loneliness Measure Purpose

  • We focused on the extent of loneliness in persons with

MS compared with healthy controls, and considered MS as an antecedent of loneliness.

  • We examined demographic variables, and features and

symptoms of MS as correlates of loneliness.

  • Antecedents: sociodemographic characteristics, disability

and functional limitations

  • Consequences or possible manifestations of loneliness:

common symptoms of MS including depression, anxiety, fatigue, and QOL

slide-3
SLIDE 3

Participant Inclusion Criteria

MS (1) Age 18-64 years (2) Definite diagnosis of MS (3) Self-reported Expanded Disability Status Scale (EDSS) score < 8.0 (4) Relapse free in past 30 days (5) Willing and able to visit the University of Illinois at Urbana-Champaign on two testing occasions Control (1) age 18-64 years (2) Willing and able to visit the University of Illinois at Urbana-Champaign on two testing occasions *Controls were matched to the MS sample on age, sex, height, and weight.

Measures

  • Loneliness

– UCLA Loneliness Scale7

  • 20 items that are combined as a single measure of one’s

subjective experience of loneliness, and does not include terms such as “lonely” or “loneliness” to reduce response bias

  • Individual responses are scored (1-4) and then summed

into an overall score that ranges between 20 and 80. Higher scores reflect higher degrees of loneliness.

  • 7D. Russell, Peplau, & Cutrona, 1980;

Measures

  • Neurological Disability

– EDSS8

  • Functional and Disability Limitations

– Late Life Function and Disability Instrument (LL-FDI) 9

  • Symptoms

– Hospital Anxiety and Depression Scale (HADS) 10 – Modified Fatigue Impact Scale (MFIS) 11

  • Physical and Mental Health Related Quality of Life

– Multiple Sclerosis Impact Scale (MSIS -29) 12

9Kurtzke, 1983; 10Motl, McAuley, & Suh, 2010; 11Zigmond & Snaith, 1983; 12Fisk et al., 1994; 13McGuigan &

Hutchinson, 2004

Procedure

  • All participants provided informed consent approved by

University IRB

  • The data were collected as part of another study examining

measures of aerobic and muscular fitness in MS across the disability spectrum13

  • Participants underwent a neurological evaluation for

generation of an EDSS score, and further completed self- report measures (demographics scale, UCLA Loneliness Scale, HADS, MFIS, MSIS-29, and LL-FDI).

13 Pilutti et al., 2015

slide-4
SLIDE 4

Data Analysis

  • Data were analyzed in SPSS v.22.0
  • Compared initial differences in demographic variables between

MS and control participants using ANOVA, t-tests, and chi- square statistics.

  • Compared between group differences of the putative antecedents

and consequences of MS using t-test, effect sizes based on Cohen's d, and associations using bivariate Pearson (rp) correlations.

  • Stepwise regression analysis to examine which of the

antecedents best explained the variance of loneliness scores; we included variables that demonstrated significant associations in the univariate analyses.

Participants

Screened: 86

Met Inclusion Criteria: 82

Final Sample: 63 persons with MS 21 healthy controls

Screened: 22

Met Inclusion Criteria: 22

Disqualified: 4 Disqualified: 0 Withdrew: 18 Withdrew: 0 No UCLA data: 1 No UCLA data: 1

Participant Characteristics

Table 1. Sociodem ographic and Clinical Differences between MS and Control groups. Characteristic MS (n=63) Control (n=21) p-value Sex (% fem ale) 71.9% 77.3% .78 Age, years 52.0 (7.8) 51.1 (10.4) .68 Race (% Caucasian) 90.6% 77.3% .22 BMI (kg/ m 2) 27.1 (6.8) 25.7 (6.2) .40 Marital Status (% m arried) 63.0% 59.1% .80 Em ployed (% em ployed) 43.8 % 90 .9% .0 0 Education (% som e college) 84.4% 90.8% .44 Annual Household Incom e (% over $40 ,0 0 0 ) 67.2% 95.5% .16 EDSS, m edian (IQR) 4.0 (4.0)

  • Disease Course (% RRMS or benign)

78.0%

  • Disease Duration, years

13.2 (8.8)

  • UCLA Score

33.7 (13.1) 27.3 (8 .3) 0 .0 4 UCLA Adjusted Score* 33.1(1.6) 29.3 (2.8) 0.27

  • Note. Values are m ean (SD), unless otherwise noted. *Adjusted m ean scores based on ANCOVA controlling for

em ploym ent status.

Table 2. Categorical Putative Antecedents of Loneliness in MS Characteristics n (%) UCLA mean (SD) t-test p-value Cohen's d Sex Fem ale 45 (71.4) 33.2 (13.2)

  • 0.46

0.65 0.13 Male 18 (28.6) 34.9 (13.2) Race Caucasian 58 (92.1) 33.3 (13.2) 0.97 0.34 0.45 Other 5 (7.9) 39.2 (11.1) Marital Status Married 40 (63.5) 30.8 (11.6) 2.48 0 .0 2 0 .64 Not Married 23 (36.5) 38.9 (14.2) Em ploym ent Status Em ployed 28 (44.4) 30.5 (13.0) 1.78 0.08 0.45 Unem ployed 35 (55.6) 36.3 (12.8) Education No college education 9 (14.3) 31.7 (13.0)

  • 0.51

0.62 0.18 Som e college education 54 (85.7) 34.1 (13.2) Annual Household Incom e <$40 ,0 0 0 20 (31.7) 35.8 (11.4) 0.83 0.41

  • 0.22

>$40 ,0 0 0 43 (68.3) 32.8 (13.9) Type of MS RRMS and Benign MS 49 (77.8) 34.0 (13.9)

  • 0.35

0.73

  • 0.10

Progressive MS 14 (22.2) 32.7 (10.4)

slide-5
SLIDE 5

Table 3. Continuous Putative Antecedents and Consequences of Loneliness in MS (N=63) Variable Pearson correlation coefficients p-value Antecedents Age, years 0.19 0.15 Disease duration, years 0.16 0.23 EDSS 0.11 0.41 BMI 0.16 0.23 LL-FDI, Upper extrem ity function

  • 0 .28

0 .0 3 LL-FDI, Basic lower extrem ity function

  • 0.15

0.26 LL-FDI, Advanced lower extrem ity function

  • 0.10

0.43 LL-FDI, Social Disability Frequency

  • 0 .49

0 .0 0 LL-FDI, Personal Disability Frequency

  • 0.20

0.13 LL-FDI, Social Disability Lim itations

  • 0 .38

0 .0 0 LL-FDI, Personal Disability Lim itations

  • 0 .29

0 .0 3 Consequences HADS, Anxiety 0.24 0.08 HADS, Depression 0 .49 0 .0 0 MFIS, Physical fatigue 0.21 0.10 MFIS, Cognitive fatigue 0 .34 0 .0 1 MFIS, Psychosocial fatigue 0 .30 0 .0 2 MSIS-29, Physical QOL 0.25 0.05 MSIS-29, Psychological QOL 0 .44 0 .0 0

Results

Table 4. Sum m ary of Hierarchical Regression Analysis for Variables Predicting Loneliness in MS (N=63) Variable B SE B β Step 1 LLFDI, Social Disability Frequency

  • 2.31

0.61

  • 0.44

Step 2 LLFDI, Social Disability Frequency

  • 2.15

0.60

  • 0.41

Marital Status

  • 6.38

3.13

  • 0.23
  • Note. R2 = .20 for Step 1; change R2 = .0 5 for Step 2 (p’s <.0 5)

Preliminary Findings

  • 1. Persons with MS reported worse loneliness

than controls, and this difference was seemingly based on employment status

  • 2. Marital status, and functional and disability

frequency and limitations represented potential antecedents of loneliness among those with MS

  • 3. Depression, fatigue, and QOL represented

manifestations of loneliness among those with MS.

8Motl et al., 2010

Strengths & Limitations

  • Limitations

– Homogeneous sample – Secondary analysis

  • Strengths

– Novel investigation using validated measure of loneliness – Theory-based explanation of loneliness – Analysis with a healthy control group

slide-6
SLIDE 6

Conclusion

  • Our results suggest that MS and its manifestations

represent putative antecedents and consequences of loneliness.

  • Additional research using a social psychological

framework is needed for continued understanding of the antecedents and manifestations of loneliness in MS.

Acknowledgments

  • UIUC ENRL director: Dr. Robert Motl

Thank you! Questions?