
SLIDE 1
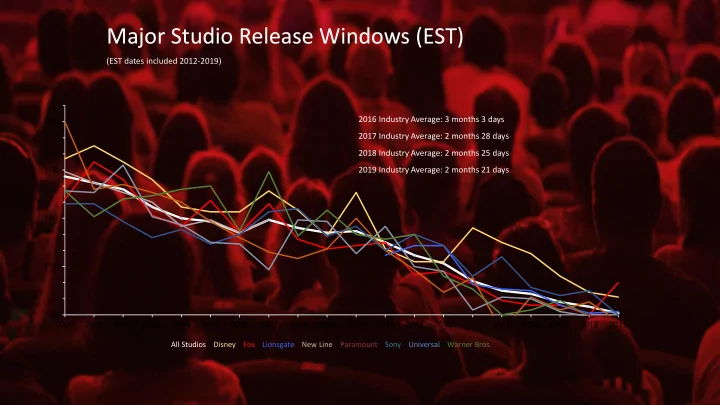
Major Studio Release Windows (EST)
(EST dates included 2012-2019)
80 110 140 170 200 2000 2001 2002 2003 2004 2005 2006 2007 2008 2009 2010 2011 2012 2013 2014 2015 2016 2017 2018 2019
2016 Industry Average: 3 months 3 days 2017 Industry Average: 2 months 28 days 2018 Industry Average: 2 months 25 days 2019 Industry Average: 2 months 21 days
All Studios Disney Fox Lionsgate New Line Paramount Sony Universal Warner Bros.