MAIN ST RESILIENCE PLAN Community Workshops Broad St. Meeting #2 - - PowerPoint PPT Presentation

main st resilience plan
SMART_READER_LITE
LIVE PREVIEW

MAIN ST RESILIENCE PLAN Community Workshops Broad St. Meeting #2 - - PowerPoint PPT Presentation

MAIN ST RESILIENCE PLAN Community Workshops Broad St. Meeting #2 CITY OF NEW ORLEANS August 6, 2015 AGENDA Welcome & Introductions Project Overview Vulnerability Assessment Preliminary Findings Shocks & Stresses


slide-1
SLIDE 1

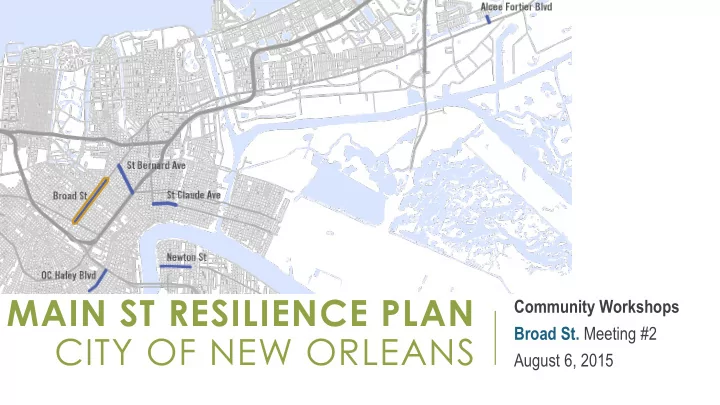
MAIN ST RESILIENCE PLAN CITY OF NEW ORLEANS

Community Workshops Broad St. Meeting #2 August 6, 2015

slide-2
SLIDE 2

AGENDA

  • Welcome & Introductions
  • Project Overview
  • Vulnerability Assessment Preliminary Findings
  • Shocks & Stresses
  • Infrastructure
  • Buildings
  • People
  • Discussion on Resiliency Strategies

2

slide-3
SLIDE 3

Goals Schedule Community Engagement

PROJECT OVERVIEW

slide-4
SLIDE 4

PROJECT GOALS

1. Developed a shared definition of resilient commercial corridors for New Orleans 2. Create a measurable and actionable methodology for assessing the resilience of commercial corridors or Main Streets. 3. Apply methodology to 6 corridors (5 State-designated Main Streets), in the city and develop individualized recommendations for each to address resiliency gaps 4. Develop how-to guides for businesses for improving resiliency as applied to business operations and for businesses/property-owners for improving building resiliency

4

City Planning Commission Metro-So Source, urce, llc llc

slide-5
SLIDE 5

PAC Meeting #3

OVERVIEW OF PLANNING PROCESS

5

Initialization

  • Defining Resilience for Main Streets
  • Review Previous Efforts

Assessment

  • Develop standardized assessment
  • Data collection (primary)
  • Business occupant survey

Analysis & Recommendations

  • Commercial and residential market analysis
  • Resilience gap analysis
  • Infrastructure improvements and revitalization strategies

Final Plan

  • Technical guides: business operations & building hardening
  • Draft and final plan; public presentations

PAC Meeting #1 PAC Meeting #2 PAC Meeting #4

March / April May / June July / August August / September Corridor workshops 1 Business workshops Community meetings Corridor workshops 2 Public presentations

slide-6
SLIDE 6

Residential and Commercial Market Infrastructure / Built Environment Risk and Other Resilience Elements

WHAT WE’VE LEARNED

slide-7
SLIDE 7

ASSESSING A RESILIENT COMMERCIAL CORRIDOR

  • How vulnerable are corridor facilities and users to shock events
  • Does the corridor facilitate economic prosperity that can withstand times of

stress?

  • Do corridor businesses have access, availability, and the capacity to engage

resources needed to weather shocks & stresses?

  • Are adequate social networks in place to support corridor businesses during

shocks and stresses?

7

slide-8
SLIDE 8

ASSESSMENT: KEY POINTS

8

slide-9
SLIDE 9

INFRASTRUCTURE & SHOCK EVENTS

  • Significant portion of corridor in

Flood Zone

  • High historic occurrence of

flood claims

9

slide-10
SLIDE 10

CORRIDOR ELEVATION

10

slide-11
SLIDE 11

BUILDINGS & SHOCK EVENTS

  • High proportion of:
  • Buildings on grade (77%)
  • Unprotected windows & doors (51%)
  • MEP not elevated (52%)
  • Buildings with appendages (75%)
  • Strengths
  • Relatively low number of buildings in

below average or worse condition (24%)

  • Model predicted flooding is minimal (0.7

ft average)

11

Max Predicted flood depth (ft above manhole rim; 10 year storm) 0.7 Claims per acre of 0.25 mi. buffer 3.67 Foundation on grade 77.0% Unprotected windows or doors 51.0% In 'below average' or worse condition 24.0% MEP not elevated 52.0% With appendages 75.0% Ground Level Openings >40% of façade 43.2%

slide-12
SLIDE 12

CORRIDOR PROFILE: AFFORDABILITY

  • Median home values are somewhat higher, but median rent is lower

12

$197,727 $183,700 $- $50,000 $100,000 $150,000 $200,000 $250,000 Median Home Value

Median Home Value

Broad 1/4 Mile New Orleans $706 $765 $650 $700 $750 $800 Median Rent

Median Rent

Broad 1/4 Mile New Orleans

slide-13
SLIDE 13
  • More people rent near Broad, and rent is a higher percentage of household

income than the rest of the city

13

CORRIDOR PROFILE: AFFORDABILITY

% Rent 69% % Own 31% % Rent 53% % Own 47%

Own vs. Rent Homes

% Rent % Own 35.0% 24.7% 0.0% 5.0% 10.0% 15.0% 20.0% 25.0% 30.0% 35.0% 40.0% Broad 1/4 Mile New Orleans

Rent as Percentage of Income

slide-14
SLIDE 14

14 Source: New Orleans MLS, GCR Analysis

HOUSING TRENDS: 2009 HOME SALES

slide-15
SLIDE 15

15 Source: New Orleans MLS, GCR Analysis

HOUSING TRENDS: 2014 HOME SALES

slide-16
SLIDE 16

MARKET ASSESSMENT

. 16

Raw SUPPLY and DEMAND indicators suggest that there is:

  • High unmet demand for:
  • General merchandise store (dollar store, City Target): $26.1 million leakage
  • Automobile dealer: $22.3 million leakage
  • Gasoline station: $10.6 million leakage
  • Modest demand for:
  • Small grocery store: $5.7 million leakage
  • Small electronics/appliance store: $3.9 million leakage

Source: Esri and Dun & Bradstreet, 2015, GCR Analysis

slide-17
SLIDE 17

DISCUSSION: IMPROVING RESILIENCE

slide-18
SLIDE 18

STRATEGIES

  • Broad is a diverse corridor and may be best viewed as a collection of unique

segments

  • Focus on characteristics of each section
  • Identify zoning or other regulatory changes that would encourage

development that matches the desired character of individual segments

  • Allow more intense/dense development at key nodes
  • Consider development of more refined design and development guidelines
  • Consider policies to allow development on grade (with appropriate floodproofing)
  • Develop, improve and maintain public gathering spaces to encourage

neighborhood cohesion, identity

18

slide-19
SLIDE 19

STRATEGIES

  • Stakeholder coordination
  • Improve coordination among businesses
  • Identify stakeholder groups to act as corridor champions
  • Identify opportunities for maintaining affordability
  • Access:
  • Identify nodes for focused pedestrian facility improvements to link corridor to

surrounding neighbhorhoods

  • Consider adjustments to transit routes, stops & transfers

19

slide-20
SLIDE 20

THANK YOU

Dwight Norton – GCR dnorton@gcrincorporated.com Judith Dangerfield – Metro Source judithdangerfield@metro-source.com

20