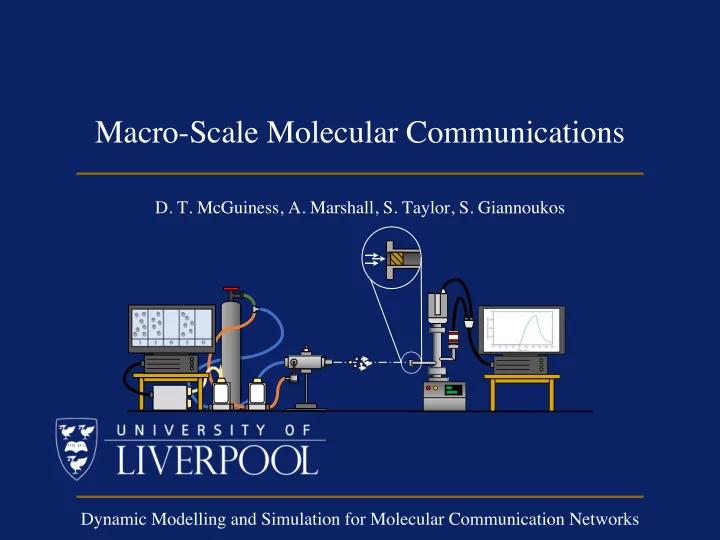
SLIDE 1 Macro-Scale Molecular Communications
- D. T. McGuiness, A. Marshall, S. Taylor, S. Giannoukos
Dynamic Modelling and Simulation for Molecular Communication Networks
SLIDE 2
Introduction
v Molecular Communication (MC) is the act of transmitting information using particles (i.e. chemicals) instead of EM waves. v Research in field in mostly done in micro-scale (nm - µm).
v Almost all theoretical, little or no practical experiments
v Recently there have been interest in the larger scale of MC: macro- scale (cm - m). v There are areas where Macro-scale could be utilized.
v E.g. Underwater and underground communications
SLIDE 3
Introduction
v In this study, experimental analysis of molecular communication in macro-scale (cm - m) is conducted. v An in-house-built odour generator is used as a transmitter. v A mass spectrometer (MS) is used as a detector.
SLIDE 4 Experimental Setup
Bulk Flow B = Q +q
Q q
Main N2 Gas Signal Flow (q) Carrier Flow (Q) MFC-to-Controller Cable Controller-to-PC Cable
MFC Controller 1 3 2 1 Modulation information is carried to the MFC Controller 2 From the controller the pulses are sent to MFCs where they are converted into gas pulses 3 These pulses are carried into the mixing chamber (Q) and evaporation chamber (q)
Transmitter Side
SLIDE 5 Experimental Setup
Transmitter
Evaporation Chamber Mixing Chamber Signal Flow Rate ( q ) Carrier Flow Rate ( Q ) Bulk Flow B = Q + q
A B A B
The carrier flow carries the chemicals from the mixing chamber to the transmission medium The signal flow carries the chemicals from the evaporation chamber to the mixing chamber
1
1
1
SLIDE 6
(1) (2) (3) (4) (5) (6)
Experimental Setup
Evaporation Chamber
SLIDE 7 Experimental Setup
Detector inlet Semi-permeable membrane Single-ion Monitoring (SIM) MS Vacuum Pressure Controller Retrieved ion Data
Detector Side
SLIDE 8
Experimental Setup
Experimental Setup of the Study
SLIDE 9 Experimental Setup
Experimental Setup: (a) Transmitter (b) Evaporation Chamber (c) Mass Flow Controller
SLIDE 10
Transmission of Molecules
v Transmission of molecules in the macro-scale (cm – m) can be explained using advection-diffusion equation (ADE) with the expression given below. !"($, &) !& = ) !*"($, &) !&* − , !" $, & !$ + . v Where C(x, t) is the concentration (kg/m), t is the duration (s), u is the advective flow, x is the transmission distance (m) and R is the sink and/or source.
SLIDE 11
Transmission of Molecules
v The prototypical solution where a mass (M) is injected into the system instantaneously (t = 0 s) . ! " = 0, & = 0 = '( " v Based on this initial condition, the solution for 1-D environment can be expressed as; ! ", & = ' 4*+& exp − " − 0& 1 4+&
SLIDE 12 Transmission of Molecules
v By integration the function with respect to distance, the amount of particle in that given area is calculated. !∗ #, % = ( ) #, % *#
+,
v Finally by subtracting these particles from the initial injection, the amount of particles that are absorbed can be calculated. ! #, % = / − ( ) #, % *#
+,
SLIDE 13 !" !# ! $ % = 0 !( M -∫ +
,- .-
/! = 0 0 ! M (A) !" !# ! $ 0 < ' < ∞ !) M -∫ ,
/.
0! = M∆ (B) !" !# ! $ % = ∞ !( M -∫ +
,- .-
/! = M (C)
Model Diagram [1]
SLIDE 14
Transmission of Molecules
v The amount of chemicals that are absorbed can be defined as;. !" #, % = ' − ' 2 erf #. − /% 2 0% + erf #2 + /% 2 0% v The amount of mass absorbed in a given symbol period of T; '3 = ! #, 4 - ! #, % = 0 v The flushed chemicals in the system can be represented as; !6 #, % = '3 2 erf #. − /% 2 0% + erf #2 + /% 2 0%
SLIDE 15
Injected Mass
(a) Experimental Results (b) Maximum signal amplitude [1] (a) (b)
SLIDE 16
Injected Mass
(a) Signal Variance (b) Signal Correlation [1]
SLIDE 17
Injected Mass
(a) Signal Energy (b) Signal Modelling [1] (a) (b)
SLIDE 18
Advective Flow
(a) Experimental Results (b) Maximum signal amplitude [1] (a) (b)
SLIDE 19
Advective Flow
(a) Signal Energy (b) Signal Modelling [1] (a) (b)
SLIDE 20
Symbol Duration
Experimental Results [1]
SLIDE 21
Symbol Duration
Theoretical Comparison [1] (b)
SLIDE 22
Thank you for listening
[1] McGuiness, D. T., et al. "Parameter Analysis in Macro-Scale Molecular Communications using Advection-Diffusion." IEEE Access (2018). [2] McGuiness, D. T., et al. "Asymmetrical inter-symbol interference in macro-scale molecular communications." Proceedings of the 5th ACM International Conference on Nanoscale Computing and Communication. ACM, 2018.
Molecular Signal “Call Me Ishmael” [2]