long exposure digital holography applied to study mixing
play

Long-exposure digital holography applied to study mixing at the - PDF document

23.10.2017 Long-exposure digital holography applied to study mixing at the laboratory analogue of cloud top J.L. Nowak 1 , J. Fugal 2 1 Institute of Geophysics, University of Warsaw, Poland 2 Institute for Atmospheric Physics, Johannes


  1. 23.10.2017 Long-exposure digital holography applied to study mixing at the laboratory analogue of cloud top J.L. Nowak 1 , J. Fugal 2 1 Institute of Geophysics, University of Warsaw, Poland 2 Institute for Atmospheric Physics, Johannes Gutenberg-University Mainz, Germany 
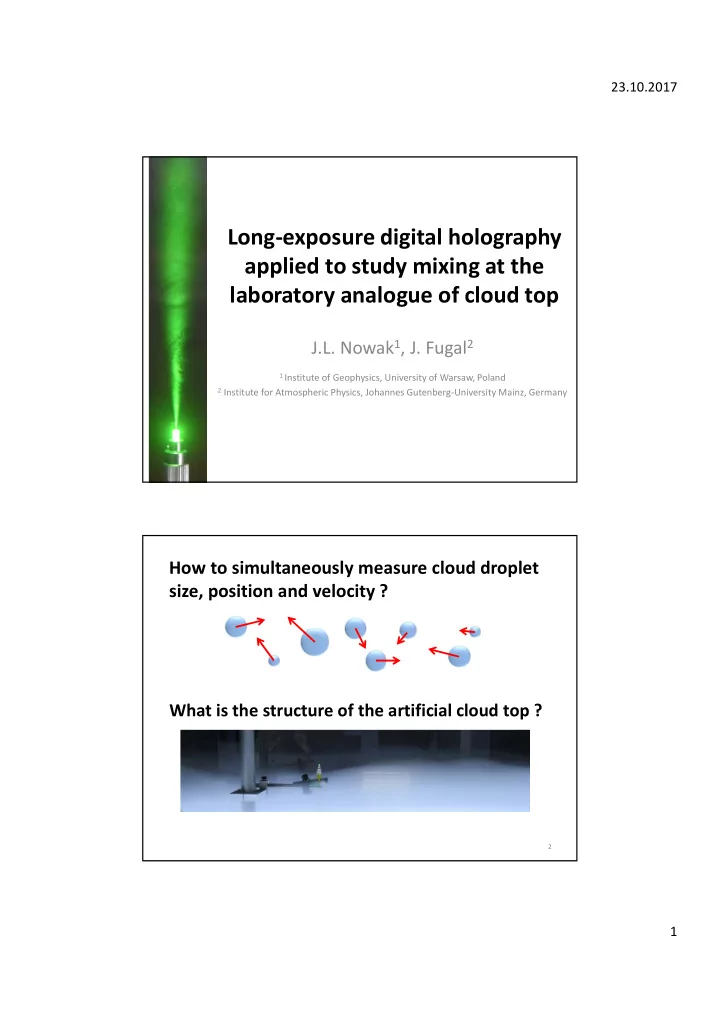
How to simultaneously measure cloud droplet size, position and velocity ? What is the structure of the artificial cloud top ? 2 1

  2. 23.10.2017 Hologram is an interference pattern of 2 beams: reference and scattered light CCD 4.2 MP camera Microscope Lens cover Hologram plane Object Sample volume ~ 1 cm 3 Single-mode fiber Laser 532 nm 3 Single long-expos. hologram contains information about particle size, position and 2C velocity Exposure time: 5 ms Trace length ~ 110 μm Trace width ~ 18 μm Diameter ~ 18 μm Velocity ~ 1.8 cm/s • Vertical position: depth focusing based on image gradient • Horizontal position: center of the particle trace • Horizontal velocity: length and orientation of the trace • Droplet diameter: width of the trace 4 2

  3. 23.10.2017 How to find particles in the reconstructed volume ? Raw hologram Quality control Background correction Numerical reconstruction (angular spectrum method) Object detection based on thresholding 3D pixel patches 5 How to distinguish between droplets and artifacts ? 3D pixel patches Depth focusing, Lateral positioning Parameter estimation (~90) Refinement based on patch parameters Machine learning approach Random subset (~1%) manual classification Fitting optimal classification model Automated classification with the model 6 3

  4. 23.10.2017 Simpler model makes more mistakes in classification of objects from experimental holograms Detection Model error E 𝐹 = 𝑥 �� 𝑆 �� + 𝑥 �� 𝑆 �� Decision tree 31.3 % Miss rate False alarm rate Logistic 26.9 % regression 𝑥 �� = 1 3 𝑥 �� = 2 Support vector 3 23.7 % machine Detection performance depends on droplet size according to tests on simulated holograms Diameter [μm] 5 10 15 20 25 False Overall detection rate 11 % 44 % 75 % 86 % 87 % 7 % 7 How to produce a cloud in the lab ? 8 4

  5. 23.10.2017 How the laboratory cloud compares to nature ?  cloud - clear air interface  mixing  temperature inversion  droplet size  droplet concentration ? spatial and temporal scales ? pressure changes ? boundary conditions ? droplet production 9 The cloud mixes with clear dry air from above 10 5

  6. 23.10.2017 Droplets are spatially distributed in filaments due to mixing and evaporation 11 12 6

  7. 23.10.2017 Statistical cloud top structure seems to be layered MVD CONC LWC Not enough to draw strong conclusion 101 holograms Mean Std Min Max Error Concentration [cm -3 ] 305 222 38 1004 ? Horizontal velocity [mm/s] 6.8 3.9 0 25.6 1.8 Droplet diameter [μm] 12.7 3.2 8.5* 33 4.5 * Resolution limit 13 Summary Size, position and 2C velocity Supervised machine learning estimated with one measurement helps in particle detection Mixing at the cloud top simulated Droplets at the interface spatially in the laboratory chamber distributed in filaments Acknowledgements Contact S.V. Gilles, O. Schlenczek, W. Schledewitz A. Górska, S. Malinowski jnowak@igf.fuw.edu.pl Holosuite software package Erasmus+ student exchange programme 7

Download Presentation
Download Policy: The content available on the website is offered to you 'AS IS' for your personal information and use only. It cannot be commercialized, licensed, or distributed on other websites without prior consent from the author. To download a presentation, simply click this link. If you encounter any difficulties during the download process, it's possible that the publisher has removed the file from their server.

Recommend


More recommend