
SLIDE 1
- dpd@cityofchicago.org
- cityofchicago.org/dpd
Rahm Emanuel, Mayor
David Reifman, Commissioner
- Dept. of Planning and Development
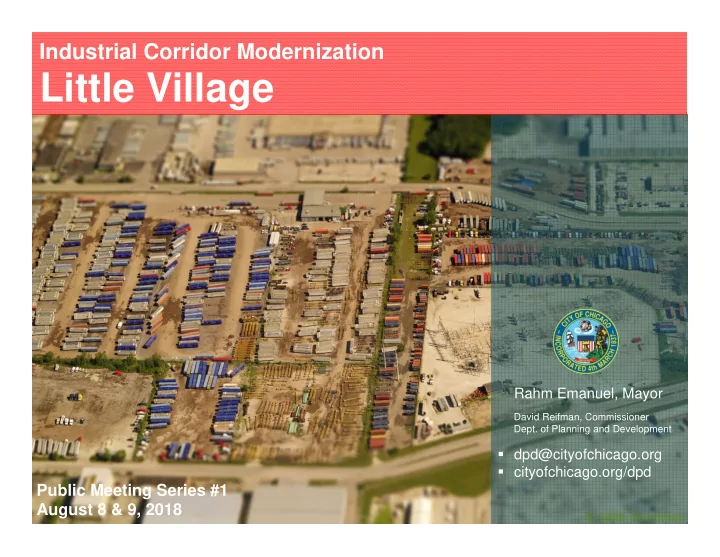
Industrial Corridor Modernization
Little Village
Public Meeting Series #1 August 8 & 9, 2018