
SLIDE 1
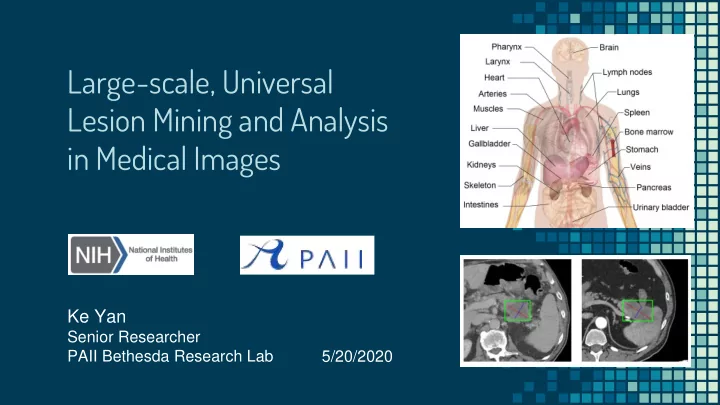
Large-scale, Universal Lesion Mining and Analysis in Medical Images
Ke Yan
Senior Researcher PAII Bethesda Research Lab 5/20/2020
Lesion Mining and Analysis in Medical Images Ke Yan Senior - - PowerPoint PPT Presentation
Large-scale, Universal Lesion Mining and Analysis in Medical Images Ke Yan Senior Researcher PAII Bethesda Research Lab 5/20/2020 Motivation Lesion analysis Radio diolog logis ists : find, measure, describe, compare,
Ke Yan
Senior Researcher PAII Bethesda Research Lab 5/20/2020
▫ Radio
diolog logis ists: find, measure, describe, compare, …
▫ Algori
gorithms thms: detect, segment, classify, retrieve, …
▫ Focus on certain body parts ▫ Lung, breast, liver, brain, etc. ▫ Require large annotation effort to annotate a small
set of images (~1K CT volumes)
2/50
▫ Mine large-scale lesion data from PACS, with
minimum human efforts
▫ Explore a variety of lesions (universal) ▫ Perform multiple clinically important tasks ▫ And eventually, help in radiologists’ daily work and
improve the efficiency and accuracy
3/50
Data curation Mining from PACS Human annotation Lesion detection Classification Step 1: Step 2: Step 3: Matching Retrieval Human selection
Segmentation Measurement
4/50
Data curation Mining from PACS Human annotation Lesion detection Classification Step 1: Step 2: Step 3: Matching Retrieval Human selection
Segmentation Measurement
5/50
Imaging Biomarkers and Computer-Aided Diagnosis Laboratory, National Institutes of Health + National Library of Medicine
Ke Yan, Xiaosong Wang, Le Lu, Ronald M. Summers, "DeepLesion: Automated Mining of Large-Scale Lesion Annotations and Universal Lesion Detection with Deep Learning", Journal of Medical Imaging, 2018
“bookmarks” ▫ Marked by radiologists in their
daily work
▫ Measure significant abnormalities
Evaluation Criteria in Solid Tumors) guidelines
8/50
https://nihcc.app.box.com/v/DeepLesion
Frontal view of body
9/50
10/50
all possible abnormal findings
complementary
11/50
Summers, “Deep Lesion Graphs in the Wild: Relationship Learning and Organization of Significant Radiology Image Findings in a Diverse Large-scale Lesion Database,” in CVPR, 2018.
ieval al: find similar lesions from other patients ▫ Usage: help understanding
13/50
14/50
▫ Intuition: volumetric medical images
are intrinsically structured!
▫ The superior-inferior slice order
information can be leveraged for self-supervision
z = 0.59 (from SSBR) x = 0.28, y = 0.53 (relative)
Yan, Lu, Summers. Unsupervised Body Part Regression via Spatially Self-ordering Convolutional Neural Networks, ISBI 2018
15/50
each slice score towards the correct direction relative to other slices
16/50
17/50
18/50
19/50
▫ A selected sequence of 5 instances can be
decomposed into three triplets: {ABC, ACD and ADE} ; Joint Loss →
20/50
1024D feature embedding vector for each lesion instance
21/50
Ke Yan et al., “Deep Lesion Graphs in the Wild: Relationship Learning and Organization of Significant Radiology Image Findings in a Diverse Large-scale Lesion Database,” CVPR 2018.
22/50
23/50
Summers, “Holistic and comprehensive annotation of clinically significant findings on diverse CT images: Learning from radiology reports and label ontology,” in CVPR, 2019.
▫ Fine-grained semantic information is missing
Where What How
25/50
grained set of relevant labels, such as the lesion’s body y pa part, type pe, , and attributes utes
Nodule: 0.93 Right mid lung: 0.92 Lung mass: 0.89 Perihilar: 0.64 …
26/50
▫ Not sufficient for lesion-level prediction
27/50
28/50
▫ 46,658 terms related to radiology
29/50
▫ coarse-level (e.g., chest, abdomen) ▫ organs (lung, lymph node) ▫ fine-grained organ parts (right lower lobe, pretracheal LN) ▫ other body regions (porta hepatis, paraspinal)
▫ general terms (nodule, mass) ▫ more specific ones (adenoma, liver mass)
▫ intensity, shape, size, etc. (hypodense, spiculated, large)
30/50
▫ A fine-grained body part is part of a coarse-scale one
(left lung < lung)
▫ A type is sub-type of another one (hemangioma <
neoplasm)
▫ A type is located in a body part (lung nodule < lung) ▫ Extraction from RadLex → manual correction, 137
parent-child pairs
31/50
▫ Manually annotate, 4,461 pairs
32/50
is irrelevant or uncertain
propose a text-mining module: relation extraction CNN followed by rule filters
Unchanged large nodule bilaterally for example right lower lobe OTHER_BMK and right middle lobe BOOKMARK. Dense or enhancing lower right liver lesion BOOKMARK possibly due to hemangioma.
Yifan Peng et al., "A self-attention based deep learning method for lesion attribute detection from CT reports," IEEE International Conference on Healthcare Informatics (ICHI), 2019.
33/50
Large, nodule, right mid lung
Filtered labels Large, nodule, right mid lung, right lung, lung, chest Expanded labels Label expansion Hierarchical label relations Text-mining module Large, nodule, right lower lobe, right mid lung Extracted labels Unchanged large nodule bilaterally for example right lower lobe OTHER_BMK and right middle lobe BOOKMARK. Sentence
34/50
Conv1_2 2_2 3_3 4_3 5_3
VGG-16 with BatchNorm Lesion patch
Predicted scores 𝒕
1.12
… 0.01 2.35 FC Multiscale features Weighted CE loss RoIPool 5×5 → FC 256
Sigmoid
35/50
▫ Some labels/samples are difficult to learn
▫ Mined labels are incomplete, so the negative labels
may be unreliable
▫ OHEM may treat missing labels as hard negatives
36/50
▫ Use mutually exclusive label relation to infer reliable
negative labels
▫ OHEM is only performed on reliable labels → RHEM
37/50
▫ Online difficulty of reliable label c of lesion i ▫ Randomly sample examples (lesion-label pairs) in a
minibatch according to 𝜀
▫ Examples with large 𝜀 are emphasized
mechanism for imbalanced labels
38/50
between labels
39/50
▫ Find lesions with similar
semantic labels
▫ Increase interpretability
40/50
41/50
validation: 1,852; test: 1,759 (text-mined ined test set set)
500 random lesions in the test set (hand- labeled ed test set)
42/50
Method Text-mined test set Hand-labeled test set AUC Precision Recall F1 AUC Precision Recall F1 LesaNet 0.9344 0.3593 0.5327 0.3423 0.9398 0.4737 0.5274 0.4344 w/o score propagation layer 0.9275 0.3680 0.4733 0.3233 0.9326 0.4833 0.4965 0.4092 w/o RHEM 0.9338 0.2983 0.5550 0.3178 0.9374 0.4341 0.5327 0.4303 w/o label expansion 0.9148 0.3523 0.5104 0.3270 0.9236 0.4503 0.5420 0.4205 w/o text-mining module 0.9334 0.3365 0.5350 0.3324 0.9392 0.4869 0.5361 0.4250 w/o triplet loss 0.9312 0.3201 0.5394 0.3274 0.9335 0.4645 0.5624 0.4337
43/50
44/50
45/50
46/50
47/50
databases and reports
labels to organize the data
49/50
Acknowledgment
Research Program of the NIH Clinical Center and National Library of Medicine.
body parts, lesion types, and attributes
and “left upper lung” in (c), “hemangioma” and “metastasis” in (g)
▫ Rare and/or variable labels were not learned very
well, such as “conglomerate” and “necrosis” in (b)
▫ Some labels may not have a clear definition, such as
“mass” and “nodule” in (d)
51/50
▫ Hyperlinks (~20K) ▫ Sizes and slice number
references (~6K, detected using regular expressions)
using NLTK
missing periods
FINDINGS: Lungs, pleurae: Unchanged diffuse ground-glass
Unchanged reticular and nodular juxtapleural features for example left upper lobe BOOKMARK (1.0 cm x 0.9 cm) (series 4, image 136) and left lower lobe associated pleural thickening. Cardiac, Vascular: coronary, aorta, great vessels: unremarkable Decreased lymphadenopathy for example axilla BOOKMARK (1.5 cm x 1.2 cm) (series 2, image 8) Mediastinum: Unchanged mediastinal adenopathy Upper abdomen: Unchanged splenomegaly BOOKMARK (15.2 cm) (series 2, image 58) Bones, soft tissues: no evidence of suspicious sclerotic
52/50
▫ To lower-case, remove non-ASCII characters ▫ Para aortic, para-aortic, paraaortic → paraaortic ▫ Word tokenization ▫ Lemmatize: plural to singular
and 1 in val/test set)
53/50
Yifan Peng et al., "A self-attention based deep learning method for lesion attribute detection from CT reports," IEEE International Conference on Healthcare Informatics (ICHI), 2019. 54/50
▫ Positive cases are sparse for most labels
55/50
ghted ed CE loss: clamped the weights β to be at most 300
plet et loss: T = 5000, loss weight λ = 5
56/50
500 random lesions in the test set (hand- labeled ed test set) ▫ Reduce missing annotations ▫ In average, there are 4.2 labels per lesion in the text-
mined test set, and 5.4 in the hand-labeled test set
57/50
precisio ision, n, recall, , and F1
58/50
▫ Many labels have few positive cases in the test set ▫ Missing annotations
59/50
▫ Learning more labels
jointly does not affect accuracies of single labels significantly
▫ Rare labels generally
have low F1s
60/50
61/50