
SLIDE 1
Learning in Graphical Models
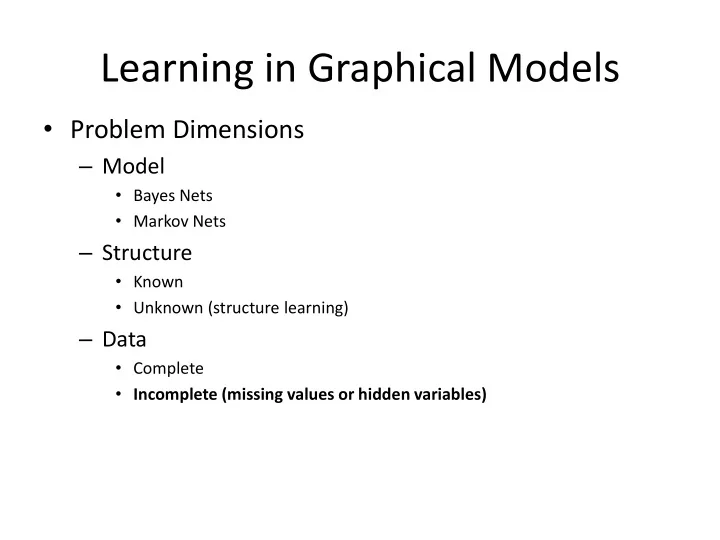
- Problem Dimensions
– Model
- Bayes Nets
- Markov Nets
– Structure
- Known
- Unknown (structure learning)
– Data
- Complete
- Incomplete (missing values or hidden variables)