Lead Partner Event 13:30 Claims general points 14:00 Claims EUMIS - - PDF document

lead partner event
SMART_READER_LITE
LIVE PREVIEW

Lead Partner Event 13:30 Claims general points 14:00 Claims EUMIS - - PDF document

17/07/2018 11:00 2018 Overview 11:15 Audit Authority Article 127 Visits 11:45 Managing Authority Article 125 Visits 12:15 Lunch 13:00 Update on EU Exit Negotiations Lead Partner Event 13:30 Claims general points 14:00 Claims EUMIS


slide-1
SLIDE 1

17/07/2018 1 Lead Partner Event June 2018

11:00 2018 Overview 11:15 Audit Authority Article 127 Visits 11:45 Managing Authority Article 125 Visits 12:15 Lunch 13:00 Update on EU Exit Negotiations 13:30 Claims – general points 14:00 Claims – EUMIS panel 14:30 Break – convene into ESF/ ERDF specific session 14:45 Verification Sessions – by programme 15:30 Close Phase 1 operation activity increasing across both programmes, with good opportunities to celebrate the work Structural Funds supports Systems settling into a rhythm with claims progress increasing and taking account of tighter compliance Focus on the pace for achieving Performance Framework and n+3 Clear areas where priorities have not been met – YEI Phase 2 applications now coming forward to aim to have programmes fully committed by March 2019 Working on the future direction and construct of areas supported by successor funding

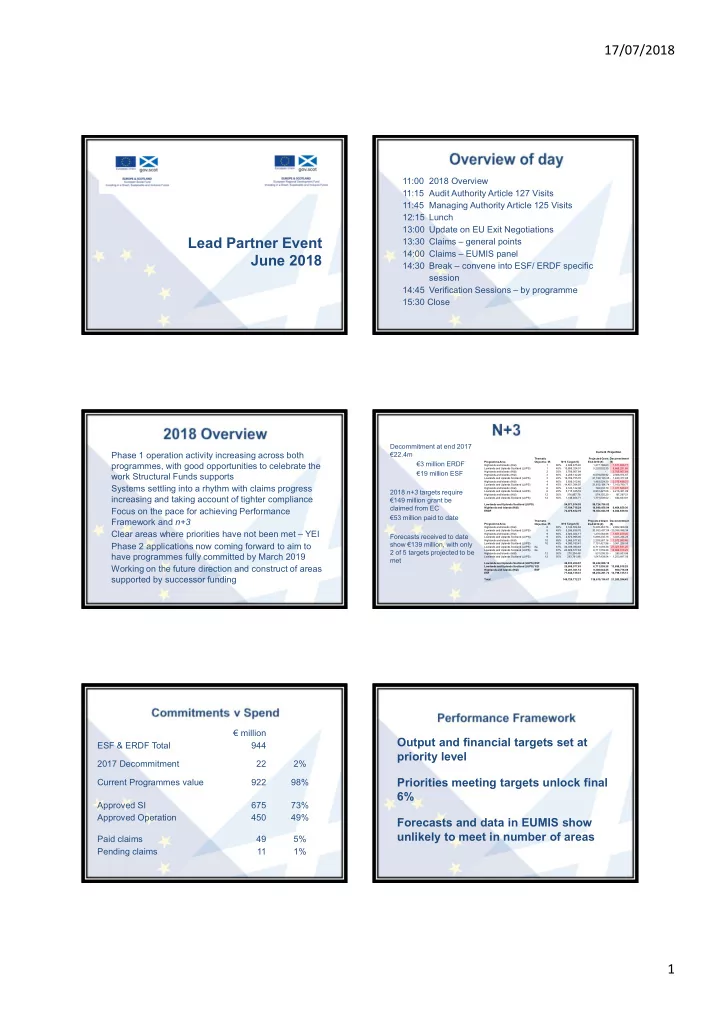
Decommitment at end 2017 €22.4m €3 million ERDF €19 million ESF 2018 n+3 targets require €149 million grant be claimed from EC €53 million paid to date Forecasts received to date show €139 million, with only 2 of 5 targets projected to be met

Current Projection Programme Area Thematic Objective IR N+3 Target (€) Projected Grant End 2018 (€) Decommitment (€) Highlands and Islands (H&I) 1 60% 2,849,675.40 1,277,788.63 1,571,886.77 Lowlands and Uplands Scotland (LUPS) 1 45% 13,889,324.01 5,220,032.35 8,669,291.65 Highlands and Islands (H&I) 2 55% 3,709,907.84

  • 3,709,907.84

Highlands and Islands (H&I) 3 60% 4,209,142.26 6,576,056.92 - 2,366,914.67 Lowlands and Uplands Scotland (LUPS) 3 45% 19,769,755.70 21,190,133.35 - 1,420,377.65 Highlands and Islands (H&I) 4 60% 3,839,012.60 1,463,524.39 2,375,488.21 Lowlands and Uplands Scotland (LUPS) 4 45% 14,451,384.97 21,612,184.74 - 7,160,799.77 Highlands and Islands (H&I) 6 60% 2,120,122.36 748,533.70 1,371,588.67 Lowlands and Uplands Scotland (LUPS) 6 45% 5,715,045.16 9,931,427.06 - 4,216,381.89 Highlands and Islands (H&I) 12 50% 376,857.78 574,155.29 - 197,297.51 Lowlands and Uplands Scotland (LUPS) 12 50% 1,146,404.71 1,771,008.52 - 624,603.81 Lowlands and Uplands Scotland (LUPS) 54,971,914.55 59,724,786.02

  • Highlands and Islands (H&I)

17,104,718.24 10,640,058.94 6,464,659.30 ERDF 72,076,632.79 70,364,844.95 6,464,659.30 Programme Area Thematic Objective IR N+3 Target (€) Projected Grant End 2018 (€) Decommitment (€) Highlands and Islands (H&I) 8 65% 3,142,554.84 5,205,463.76 - 2,062,908.92 Lowlands and Uplands Scotland (LUPS) 8 45% 5,536,838.70 30,933,437.04 - 25,396,598.34 Highlands and Islands (H&I) 9 65% 2,922,024.17 1,270,584.98 1,651,439.20 Lowlands and Uplands Scotland (LUPS) 9 45% 2,872,995.95 5,898,230.18 - 3,025,234.23 Highlands and Islands (H&I) 10 65% 3,866,577.62 2,293,587.16 1,572,990.46 Lowlands and Uplands Scotland (LUPS) 10 45% 4,090,183.41 7,151,421.96 - 3,061,238.55 Lowlands and Uplands Scotland (LUPS) 8a 67% 34,039,390.63 6,711,559.38 27,327,831.25 Lowlands and Uplands Scotland (LUPS) 8a 67% 20,609,577.63 6,711,559.38 13,898,018.25 Highlands and Islands (H&I) 12 50% 270,204.48 531,008.35 - 260,803.86 Lowlands and Uplands Scotland (LUPS) 12 50% 293,791.98 1,547,439.54 - 1,253,647.56 Lowlands and Uplands Scotland (LUPS) ESF 46,833,200.67 52,242,088.10

  • Lowlands and Uplands Scotland (LUPS) YEI

20,609,577.63 6,711,559.38 13,898,018.25 Highlands and Islands (H&I) ESF 10,201,361.12 9,300,644.25 900,716.88 ESF 77,644,139.41 68,254,291.72 14,798,735.13 Total 149,720,772.21 138,619,136.67 21,263,394.43

€ million ESF & ERDF Total 944 2017 Decommitment 22 2% Current Programmes value 922 98% Approved SI 675 73% Approved Operation 450 49% Paid claims 49 5% Pending claims 11 1%

Output and financial targets set at priority level Priorities meeting targets unlock final 6% Forecasts and data in EUMIS show unlikely to meet in number of areas

slide-2
SLIDE 2

17/07/2018 2

Priority axis Category of region Milestone for 2018 Projected total end-2018 To date Projected end-2018 T 1 - Supporting Sustainable and Quality Employment and Supporting Labour Market Mobility Transition 10,826,354 8,503,257.39 25% 79% 1 - Supporting Sustainable and Quality Employment and Supporting Labour Market Mobility More developed 76,004,635 73,894,254.53 30% 97% 2 - Promoting Social Inclusion, combating poverty and any discrimination Transition 9,446,630 4,661,721.77 2% 49% 2 - Promoting Social Inclusion, combating poverty and any discrimination More developed 37,019,375 23,358,014.87 2% 63% 3 - Investing in Education, Training and Vocational Training for Skills and Lifelong Learning Transition 12,876,075 7,423,521.51 15% 58% 3 - Investing in Education, Training and Vocational Training for Skills and Lifelong Learning More developed 56,146,280 13,078,655.47 21% 23% 4 - Youth Employment Initiative 138,929,100 20,445,685.15 5% 15% Red = Under 65% Bold = Over 85% Priority Axis Category of Region Key Implementation Step or Output Indicator 2018 Mileston e Latest Value % 2018 Milestone Achieved 1 Transition Expenditure (€m) 10.83 2.76 25% 1 Transition Unemployed and inactive participants with multiple barriers to employment 2,092 1,042 50% 1 Transition Employed participants with multiple barriers to progressing in the labour market 30 31 103% 1 More developed Expenditure (€m) 76.00 22.59 30% 1 More developed Unemployed and inactive participants with multiple barriers to employment 24,464 9,851 40% 1 More developed Employed participants with multiple barriers to progressing in the labour market 1,224 653 53% 2 Transition Expenditure (€m) 9.45 0.20 2% 2 Transition Disadvantaged participants in workless, lone parent or low income households 846 523 62% 2 Transition Deprived or fragile communities supported 20 32 160% 2 More developed Expenditure (€m) 37.02 0.77 2% 2 More developed Disadvantaged participants in workless, lone parent or low income households 3,150 178 6% 2 More developed Deprived or fragile communities supported 29 287 990% 3 Transition Expenditure (€m) 12.88 1.92 15% 3 Transition Total participants (employed, unemployed, inactive) with ISCED level 2 or below qualification 573 191 33% 3 Transition Total participants (employed, unemployed, inactive) with ISCED level 3 or 4 qualifications 968 205 21% 3 Transition Total participants with ISCED level 5 and above qualifications 254 20 8% 3 More developed Expenditure (€m) 56.15 11.83 21% 3 More developed Total participants (employed, unemployed, inactive) with ISCED level 2 or below qualification 3,650 1,805 49% 3 More developed Total participants (employed, unemployed, inactive) with ISCED level 3 or 4 qualifications 4,361 971 22% 3 More developed Total participants with ISCED level 5 and above qualifications 1,092 123 11% 4 YEI Expenditure (€m) 138.93 6.85 5% 4 YEI Participants aged 16-24 who are unemployed or NEET 13,430 5,518 41% 4 YEI Participants aged 25-29 who are unemployed or NEET 3,570 1,317 37% Priority axis Category of region Milestone for 2018 Projected total end-2018 Projected end-2018 T 1 - Strengthening Research, technological development and innovation Transition 8,695,946 3,323,302.08 38% 1 - Strengthening Research, technological development and innovation More developed 55,727,591 16,805,736.38 30% 2 - Enhancing access to, and use and quality of ICT Transition 11,593,045

  • 0%

3 - Enhancing the Competitiveness of SMEs Transition 13,483,306 14,575,372.68 108% 3 - Enhancing the Competitiveness of SMEs More developed 67,020,293 64,336,212.49 96% 4 - Supporting a shift towards a low carbon economy in all sectors Transition 10,996,776 3,246,241.38 30% 4 - Supporting a shift towards a low carbon economy in all sectors More developed 56,106,203 69,069,240.10 123% 5 - Preserving and protecting the environment and promoting resource efficiency Transition 3,153,308 3,672,469.00 116% 5 - Preserving and protecting the environment and promoting resource efficiency More developed 23,577,497 77,679,391.88 329% Red = Under 65% Bold = Over 85% Priority Axis Category of Region Key Implementation Step or Output Indicator 2018 Milestone Latest Value % 2018 Milestone Achieved 1 Transition expenditure (€m) 8.70 1.53 18% 1 Transition Enterprises receiving support to introduce new to the firm or new to the market products 60 1 2% 1 More developed expenditure (€m) 55.73 15.53 28% 1 More developed Enterprises receiving support to introduce new to the firm or new to the market products 195 26 13% 2 Transition expenditure (€m) 11.59 0.00 0% 2 Transition ICT infrastructure contract let and implementation commenced 1 0% 3 Transition expenditure (€m) 13.48 1.73 13% 3 Transition Enterprises receiving support 520 57 11% 3 More developed expenditure (€m) 67.02 27.08 40% 3 More developed Enterprises receiving support 1800 1694 94% 4 Transition expenditure (€m) 11.00 0.23 2% 4 Transition Low carbon projects receiving non-financial or financial support 23 2 9% 4 Transition Transport hubs with contracts let or construction commenced 2 0% 4 More developed expenditure (€m) 56.11 2.55 5% 4 More developed Low carbon projects receiving non-financial or financial support 118 17 14% 4 More developed Transport hubs with contracts let or construction commenced 4 0% 5 Transition expenditure (€m) 3.15 1.48 47% 5 Transition Organisations receiving non-financial or financial support 157 371 236% 5 More developed expenditure (€m) 23.58 7.65 32% 5 More developed Organisations receiving non-financial or financial support 752 1336 178% 5 More developed Projects delivering new/improved green infrastructure which have commenced (main contract let or construction started) 4 0%

Number extensions approved to date at SI level. Starting to see operations coming in. Need sufficient claims to be submitted and paid before can assess phase 2 Currently aiming towards all approvals by 29 March 2019

slide-3
SLIDE 3

17/07/2018 3

Audit Authority

  • Article 127 Visits
  • Two Stage Approach
  • 100% of Operations
  • Regulation and Key Requirements
  • Lessons Learned 07-13 Programmes
  • Pilot Visits
  • Co-ordinating Visit
  • Scheduling Visits
  • Notification of Visit
  • Lead Partner Guidance

Schedule - 2018

  • Phase 1 - 11 June to 27 July 2018
  • Phase 2 - 13 August to 30 September 2018
  • Phase 3 - 15 October to 15 December 2018
  • Cost and File Check
  • New – Staff Interviews
  • Stage 2 Report
slide-4
SLIDE 4

17/07/2018 4

Update on EU Exit Negotiations

David Fleetwood, Directorate for External Affairs Scottish Government

Guidance

  • Commission guidance has been available from start of programmes
  • Monitoring and Evaluation Guidance - key documents for all involved
  • MA Guidance has been expanded to clarify rather than change

Resource

  • Review resource
  • Part-time staff

Verifications

  • Errors across claims - as get into live time expect error rates to lower
  • Compliance regime is challenging but necessary
  • Quality of information – check prior to submission
  • Format of evidence – number against verification

item

  • BACS total – link back to cost and participant
  • If MA can provide additional support please let us
  • know. Reviewing MA resource also.
  • Don’t submit if you don’t know it’s correct.
  • Payment not on financial checks alone. Need to

see eligible activity

  • Achievement and Outputs - Registrations under

ESF and Businesses supported under ERDF should match outputs. Remember to record both.

  • Procurement – not always providing full list. Can take 3-4 weeks.
  • MA procurement managers happy speak directly to procurement people if
  • easier. Need all documents
  • Evidence to show transparent audit trail
  • Numbering and Naming of document.
  • EUMIS procurement tab
slide-5
SLIDE 5

17/07/2018 5

  • Document Checklist - full narrative
  • Common Missing Documents:
  • Published OJEU Notices
  • Tender Evaluation
  • Amending contracts without proper justification.
  • Evaluation – inadequate trail of evidence, for

example, the process to agree the final scores

  • Technical checks at evaluation stage
  • Processes have been reviewed and updated guidance published.
  • Basic principles remain the same
  • Processes updated to improve communication & claim processing:
  • LPs should provide a list of approved projects to the MA
  • The MA will carry out checks on the challenge fund application process
  • These checks need only to be done once for a challenge fund
  • After these checks are complete, costs are claimed as any other eligible cost
  • Web Interface/CSV Upload Update
  • CSV is sensitive but will save time

and human error – can provide support to ensure set up and working

  • Changes to EUMIS
  • Outputs
  • ESF – only one per participant
  • ERDF – can have multiple outputs but an output should
  • nly count once
  • Consistency across a record
  • Reports
  • Best Practice: report all relevant barriers, name

delivery organisation under ‘Supported by’

slide-6
SLIDE 6

17/07/2018 6

  • GDPR Privacy Notice on website
  • Data sharing agreements with each lead partner
  • Data collected is to evidence meet regulatory

requirements and for evaluation purposes

  • Controlled access
  • Will not transfer personal data to Commission
  • Reporting to Commission is aggregated
  • Commission auditors read only access to EUMIS
  • Participant Guidance
  • National Rules
  • Amended Application Form

https://beta.gov.scot/publications/esif-forms-guidance-2014-2020/ On EUMIS:

  • Change Request Guidance
  • Supplementary Questionnaires and updated change request
  • UK/EU Draft Withdrawal Agreement: Dec 17,

Mar 18.

  • Economy, Jobs and Fair Work Committee

launched ESIF consultation on the current programme and the future in February.

  • Over 30 written submissions received and two
  • ral evidence sessions in May.
  • Current Programme
  • Future After EU Exit
  • Next event October
  • Suggestions for group discussions
  • Presentations from lead partners during day
  • Please feedback ideas/comments – survey will be

issued.

  • Annual Event: 30 years of Cohesion Policy
  • Case study booklets