
SLIDE 1
Latency and Throughput
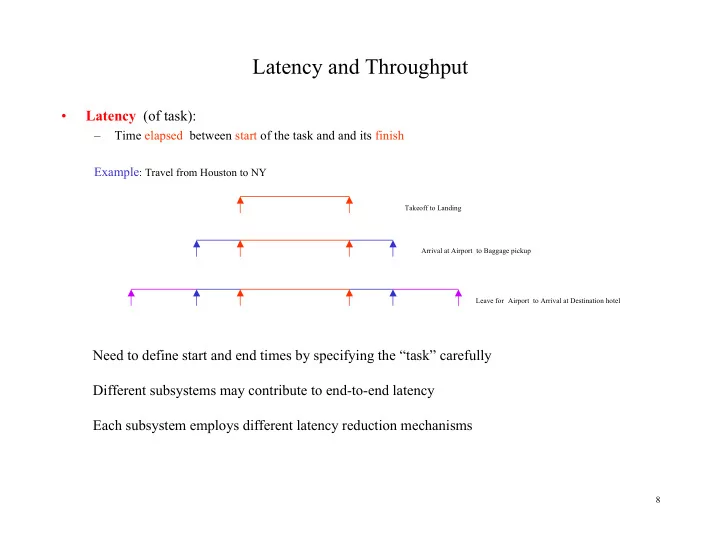
- Latency (of task):
– Time elapsed between start of the task and and its finish Example: Travel from Houston to NY
8
Takeoff to Landing Arrival at Airport to Baggage pickup Leave for Airport to Arrival at Destination hotel