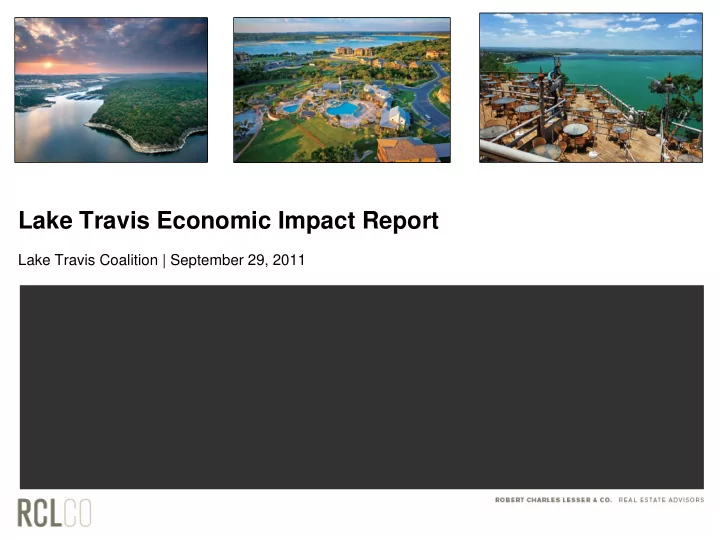

Lake Travis Economic Impact Report Lake Travis Coalition | September 29, 2011
Project Objectives and Background 1 Lake Travis Economic Impact Report
STUDY OBJECTIVES WHAT PROMPTED THE STUDY? Low Lake Levels NEGATIVE ECONOMIC IMPACT Lower Water Quality Overall Objectives : Determine economic and fiscal impacts of development and spending driven by Lake Travis in base year 2010 Quantify the impacts of low lake levels and degradation of water quality 2 Lake Travis Economic Impact Report
WHAT THE STUDY DOES NOT COVER LAKE TRAVIS‟ VALUE AS WATER SOURCE AND AMENITY Value as a Water Source Value as an Amenity Municipal Recreational Industrial Quality of Life + Critical components of the region’s past and future economic growth 3 Lake Travis Economic Impact Report
Study Area 4 Lake Travis Economic Impact Report
STUDY AREA The Study Area impacts: Travis County Towns/Cities: • Briarcliff • Jonestown • Lago Vista • Lakeway • Point Venture • Volente • Austin • Village of the Hills Lake area utility and water districts State of Texas 5 Lake Travis Economic Impact Report
1990 HOUSEHOLDS LAKE TRAVIS AREA SOMEWHAT SEPARATE FROM AUSTIN 1990 Demographic Snapshot Study Area Population: 12,772 Households: 5,413 Lake Statistics 19,000 acres 270 miles of shoreline 1 dot = 10 Households Source: 1990 Census 6 Lake Travis Economic Impact Report
2010 HOUSEHOLDS AUSTIN GROWTH PUSHES TOWARDS LAKE TRAVIS 2010 Demographic Snapshot Study Area Population more than triples (+254%) Population: 45,547 Households: 18,093 2015 Households (est): 22,079 Median Income: $81,946 Average owner-occupied home value: $347K Median year structure built: 1996 1 dot = 10 Households Source: 2010 Census 7 Lake Travis Economic Impact Report
Key Conclusions 8 Lake Travis Economic Impact Report
SUMMARY OF RESULTS OF REVENUE ANALYSIS 2010 Revenue from Existing Development Residential Property Tax $127,464,788 Commercial Property Tax $7,931,730 $23,032,193 Land Property Tax $45,241,649 Sales Tax $1,309,800 Hotel Occupancy Tax Mixed Beverage Tax $2,266,700 TOTAL $207,246,861 Total 2010 Assessed Property Values: $8.4 billion 9 Lake Travis Economic Impact Report
LAKE TRAVIS ECONOMIC IMPACT - 2010 Estimated 2.8 million visitors in 2010 • Park visitors • Boaters (marina slip renters and private dock owners) • Hotel & vacation home renters • Second home owners $ 168.8 million in total visitation- related spending $45.5 million in boat sales View toward Costa Bella Subdivision, Normal Lake Level Photo Courtesy of Griffin Communication >$11 million in sales taxes Total value-add of $112.6 million and over 1,900 jobs 10 Lake Travis Economic Impact Report
SPENDING BY STUDY AREA HOUSEHOLDS AND EMPLOYEES OVER 2/3 OF A BILLION DOLLARS Primary households and Study Area employees accounted for $688 million in spending This spending supported nearly 5,200 jobs Lago Marina, Full Lake Level Lago Marina, Drought Conditions 11 Lake Travis Economic Impact Report
KEY LAKE LEVEL ELEVATIONS Top of Mansfield Dam 750' 710' Historic High (1991) Full Elevation 681' Stable lake elevation range – positive impacts 660' 650' Some economic impacts in this range Historic Low (1951) 614' Significant economic impacts in this range Surface Elevation Lake Austin 492‟ Lake Austin 12 Lake Travis Economic Impact Report
LAKE LEVEL IMPACTS FISCAL IMPACTS Low lake levels potentially decrease revenues by $16.4 million to $21.9 million: • Lower tax revenues • Potential loss of the “premium” Premiums add 15% to combined value of Study Area residences Carlos & Charlie‟s (Lake Full) Carlos & Charlie‟s (Drought) 13 Lake Travis Economic Impact Report
LAKE LEVEL IMPACTS ECONOMIC IMPACTS Stable Low Measure Lake Levels Lake Levels Spending 7-10% 14-20%+ Jobs 125 240 Economic $7.1M $12.6M Value Jones Brothers Cove (Drought) IF lake levels are persistently low, a 50% drop in visitors potentially results in loss of 580+ jobs and $33.5 million in economic value Jones Brothers Cove (Full Lake) 14 Lake Travis Economic Impact Report
LAKE LEVEL IMPACTS BUSINESS IMPACTS – LOWER REVENUES, HIGHER COSTS Decreased demand for goods and services provided by : Marinas – $10,000 to $300,000 to move marinas to deeper water Boat charter companies Scuba operators Restaurants – 20% or more drop in revenues during 2009 drought Other water recreation companies Walkway to Hurst Harbor Marina & Johnny Fins, Normal Walkway to Hurst Harbor Marina & Johnny Fins, Drought lake level Conditions Photos courtesy of Griffin Communication 15 Lake Travis Economic Impact Report
LAKE LEVEL IMPACTS UTILITY IMPACTS – HIGHER SERVICE DELIVERY COSTS Cost to move intakes substantial (WCID #17 spent $350k moving barges in „09) Pumping and water treatment more expensive Ability to generate electricity can be compromised Potable water delivery costs increase or potential service interruptions Marshall Ford Marina, Main Basin, Normal Lake Level Marshall Ford Marina, Main Basin, Drought Lake level Photos Courtesy of Griffin Communication 16 Lake Travis Economic Impact Report
WATER QUALITY IMPACTS EXCEPTIONAL WATER QUALITY NOW Degraded water quality impacts potentially include: Costs • Local industries • Utility providers • Consumers Lake visitation and recreation • Between 5-11% of boaters suggested dissatisfaction with water quality* • For every 10% drop in boating & visitors: • -$7.1 million net economic impact • 122 lost jobs Property values • Each 1 meter drop in water clarity potentially lowers values 5-10% • $27 million to $53 million in property value losses Cleanup costs prohibitive • Raleigh-Durham region faced with $1.5 billion cleanup of Falls Lake * LCRA/Texas A&M survey of recreational boaters (2009) 17 Lake Travis Economic Impact Report
Lake Travis Economic Impact Report Lake Travis Coalition | September 29, 2011
Recommend
More recommend