
SLIDE 1
Themba Mkhwanazi, CEO Bulks Seminar & Site Visit: Brisbane, 12 November 2019
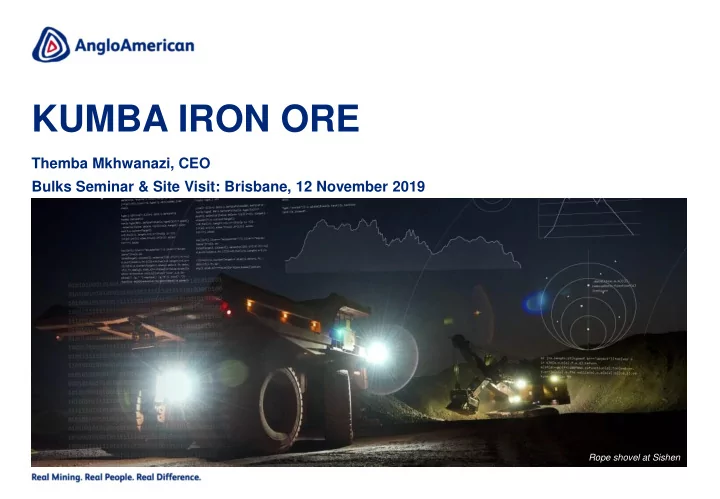
KUMBA IRON ORE
Rope shovel at Sishen
KUMBA IRON ORE Themba Mkhwanazi, CEO Bulks Seminar & Site - - PowerPoint PPT Presentation
KUMBA IRON ORE Themba Mkhwanazi, CEO Bulks Seminar & Site Visit: Brisbane, 12 November 2019 Rope shovel at Sishen CAUTIONARY STATEMENT Disclaimer : This presentation has been prepared by Anglo American plc (Anglo American) and
Themba Mkhwanazi, CEO Bulks Seminar & Site Visit: Brisbane, 12 November 2019
Rope shovel at Sishen
2 2
Disclaimer: This presentation has been prepared by Anglo American plc (“Anglo American”) and comprises the written materials/slides for a presentation concerning Anglo American. By attending this presentation and/or reviewing the slides you agree to be bound by the following conditions. The distribution of this document in certain jurisdictions may be restricted by law and persons into whose possession this document comes should inform themselves about, and observe, any such restrictions. This presentation is for information purposes only and does not constitute an offer to sell or the solicitation, inducement or an offer to buy shares in Anglo American or any other securities. Further, it does not constitute a recommendation by Anglo American or any other party to sell or buy shares in Anglo American or any other securities and should not be treated as giving investment, legal, accounting, regulatory, taxation or other advice. No representation or warranty, either express or implied, is provided in relation to the accuracy, completeness or reliability of the information contain herein. None of Anglo American, its affiliates, advisors or representatives shall have any liability whatsoever (in negligence or otherwise) for any loss howsoever arising from any use of this material or otherwise in connection with this material. Forward-looking statements This presentation includes forward-looking statements. All statements other than statements of historical facts included in this presentation, including, without limitation, those regarding Anglo American’s financial position, business, acquisition and divestment strategy, dividend policy, plans and objectives of management for future operations (including development plans and objectives relating to Anglo American’s products, production forecasts and reserve and resource positions), are forward-looking statements. By their nature, such forward-looking statements involve known and unknown risks, uncertainties and other factors which may cause the actual results, performance or achievements of Anglo American, or industry results, to be materially different from any future results, performance or achievements expressed or implied by such forward-looking statements. Such forward-looking statements are based on numerous assumptions regarding Anglo American’s present and future business strategies and the environment in which Anglo American will operate in the future. Important factors that could cause Anglo American’s actual results, performance or achievements to differ materially from those in the forward-looking statements include, among others, levels of actual production during any period, levels of global demand and commodity market prices, mineral resource exploration and development capabilities, recovery rates and other operational capabilities, the availability of mining and processing equipment, the ability to produce and transport products profitably, the availability of transport infrastructure, the impact of foreign currency exchange rates on market prices and operating costs, the availability of sufficient credit, the effects of inflation, political uncertainty and economic conditions in relevant areas of the world, the actions of competitors, activities by governmental authorities such as permitting and changes in taxation or safety, health, environmental or other types of regulation in the countries where Anglo American operates, conflicts over land and resource ownership rights and such other risk factors identified in Anglo American’s most recent Annual Report. Forward-looking statements should, therefore, be construed in light of such risk factors and undue reliance should not be placed on forward-looking
Limited in South Africa, the SIX Swiss Exchange, the Botswana Stock Exchange and the Namibian Stock Exchange and any other applicable regulations) to release publicly any updates or revisions to any forward- looking statement contained herein to reflect any change in Anglo American’s expectations with regard thereto or any change in events, conditions or circumstances on which any such statement is based. Nothing in this presentation should be interpreted to mean that future earnings per share of Anglo American will necessarily match or exceed its historical published earnings per share. Certain statistical and other information about Anglo American included in this presentation is sourced from publicly available third party sources. As such it has not been independently verified and presents the views of those third parties, but may not necessarily correspond to the views held by Anglo American and Anglo American expressly disclaims any responsibility for, or liability in respect of, such information. No Investment Advice This presentation has been prepared without reference to your particular investment objectives, financial situation, taxation position and particular needs. It is important that you view this presentation in its entirety. If you are in any doubt in relation to these matters, you should consult your stockbroker, bank manager, solicitor, accountant, taxation adviser or other independent financial adviser (where applicable, as authorised under the Financial Services and Markets Act 2000 in the UK, or in South Africa, under the Financial Advisory and Intermediary Services Act 37 of 2002). Alternative Performance Measures Throughout this presentation a range of financial and non-financial measures are used to assess our performance, including a number of financial measures that are not defined or specified under IFRS (International Financial Reporting Standards), which are termed ‘Alternative Performance Measures’ (APMs). Management uses these measures to monitor the Group’s financial performance alongside IFRS measures to improve the comparability of information between reporting periods and business units. These APMs should be considered in addition to, and not as a substitute for, or as superior to, measures of financial performance, financial position or cash flows reported in accordance with IFRS. APMs are not uniformly defined by all companies, including those in the Group’s industry. Accordingly, it may not be comparable with similarly titled measures and disclosures by other companies.
3 3
Northern Cape
SOUTH AFRICA
Western Cape
Sishen
~31Mtpa
Mining & beneficiation Export rail line Saldanha Bay Port Kolomela
~14Mtpa
2 1 2 1 3 3
4 4
Operating assets at full potential Leveraging endowment Delivering sustainable returns Our ambitions: Margin enhancement through premium product sales, P101 & cost reductions, offsetting geological inflation 20 year life of asset
5 5
Performance
Elimination of Fatalities Taskforce Leveraging new technologies to improve safety further Safety performance linked to incentive structure
Elimination of Fatalities Focus areas
Accountability and clear understanding of roles and responsibilities Identifying priority risk events and compliance to critical control management Implementing lessons learnt to prevent repeats
4.11 4.34 4.50 3.90 3.23 1.80 1.86 1 2 YTD 2019 2013 2014 2015 2016 2018 2017 LEARNING ORGANISATION MONITORING & ASSURANCE LEADERSHIP RISK & CHANGE MANAGEMENT CARING CULTURE PLANNING & SCHEDULING TRCFR1 Fatalities
Double-sided loading at Kolomela
7 7
Sishen Dense Media Separation (DMS)
Sishen JIG plant
Mining ROM ~53-56%Fe Crushing Product ~63-64%Fe Beneficiation plant Buffer Stockpile
68% lump
Kolomela Direct Shipping Ore (DSO)
Mining ROM ~64%Fe Crushing Product ~64%Fe Screening plant Buffer Stockpile
58% lump Mining ROM >59%Fe Crushing Product ~64-65%Fe Beneficiation plant Buffer Stockpile
74% lump
8 8
Cumulative target2
2019 target: ~$50m 2018 achieved: $106m
P101 benchmark
H1 2019: 67% 2012: 30%
Premium (>65% Fe) products
H1 2019: 24% 2012: 20%
Enhanced product portfolio Cost saving initiatives Improved operational efficiency
9 9
Lump delivers increased efficiency & helps meet environmental regulation as no sintering needed Average grade 2019F: 64.3% >65% Fe grade premium product is priced off Platts 65% index
Lump: 64 - 65.2% Fe grade Fines: 63.2 - 64.6% Fe grade ~30 Mtpa ~15 Mtpa
10 10
Total sales of premium (>65% Fe) products
20% 30% 40% 2022F 2012 2018
Mine redesign Portfolio upgrade Operating Model P101 Low-grade beneficiation Disciplined investment
11 11
61.9% 68.0% 2019F 2012
Product quality evolution Price premium
$/t over Platts 62 FOB3 64.0% 64.3% 2012 2019F 6 21 6 2012 H1 2019 +21 Lump ratio Fe content
12 12
Mining Processing
~5% unit cost Blast Drill
Haul Load
Crush Beneficiate Load-out
Focus on key cost drivers to improve operational performance and drive efficiencies
13 13
Adding value through increased efficiency since 20154 P101 Operating model Targeting >100% benchmark efficiency by 2022
Life of mine strip ratio
Life of mine
Sishen Operating Equipment Efficiency (%)
30 68 100
2023 Target 2012 H1 2019
+125%
Ore reserves added
14 14
Cost saving target2 2018-22 ($)
Total ~$200m
Savings2 delivered to date
Cost & efficiency offsetting haulage distances and geological inflation
Unit cost5 ($/t FOB) 38 33 36 33 16 23 37 2019F 2020F 2012 Long-term potential Geological inflation offset by cost savings from 2012 Supply chain Mining Overheads Engineering Labour Plant
15 15
Managing supply
Final version of photo to be purchased once finalised
Managing logistics
Key business partner Significant relationship improvement since 2018 Demonstrated performance uplift No material impact to date
Kolomela
17 17
Sishen: UHDMS
(ultra high density media separation)
mineral resource6
Exploration and beneficiation Kolomela: Phase 1
mineral resource7 Efficiency and optimisation Technology and optimisation Northern Cape exploration Low grade ore beneficiation <40%Fe Drill testing / Conceptual studies Feasibility Life of asset greater than 20 years Capex ~$0.2bn
Drone at Kolomela
19 19
Supporting local businesses
Host community suppliers8
Procurement from BEE businesses8
Direct social investment8
Building communities Unemployed youth graduate internship programme
97 interns placed with host employers to obtain skills and training
Batho Pele mobile health units project
Over 135,000 patients received healthcare services
Inclusive procurement programme
267 localised suppliers 2,670 jobs created 16,000 households benefitted
20 20
Returns Capabilities Assets
Premium product portfolio Life extension opportunities Mutually beneficial partnerships Operating Model FutureSmart MiningTM Marketing Strong cash generation Capital discipline Attractive & sustainable dividends
21 21
1. Total Recordable Cases Frequency Rate per million hours. 2. Cost savings are net of ~7% mining inflation per annum and structural changes including strip ratios, longer distances and increased lift. 3. Timing effects contributed $6/t. Products are priced in the month of arrival, resulting in a timing difference benefit in a rising market, and the opposite in a decreasing price market. 4. 2018 depletion of 38.2Mt Reserves and 29.2Mt saleable product excluded in order to enable like-for-like comparison with 2015. 5. Unit costs exclude royalties, depreciation and include direct support only. 6. 200Mt of low grade mineral resource under investigation for conversion to ore reserves. Typical resource to reserve conversion factors ~50% with an average product yield of ~30% 7. 85Mt of low grade mineral resource under investigation for conversion to ore reserves. Typical resource to reserve conversion factors ~60% with an average product yield of ~80-90% 8. Cumulative contributions from 2014 to H1 2019.