
1 For further information, please contact the Investor Relations Unit or visit our website at www.kasikornbank.com
KASIKORNBANK
Investor Presentation as of 3Q18
October 2018
2
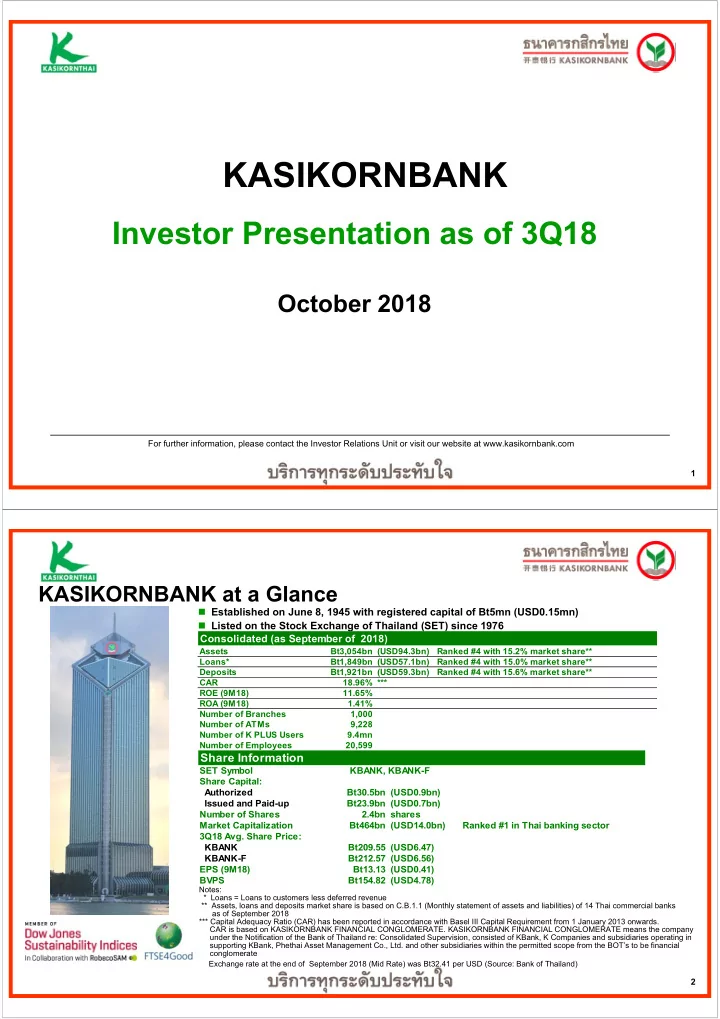
KASIKORNBANK at a Glance
Established on June 8, 1945 with registered capital of Bt5mn (USD0.15mn) Listed on the Stock Exchange of Thailand (SET) since 1976
Notes: * Loans = Loans to customers less deferred revenue ** Assets, loans and deposits market share is based on C.B.1.1 (Monthly statement of assets and liabilities) of 14 Thai commercial banks as of September 2018 *** Capital Adequacy Ratio (CAR) has been reported in accordance with Basel III Capital Requirement from 1 January 2013 onwards. CAR is based on KASIKORNBANK FINANCIAL CONGLOMERATE. KASIKORNBANK FINANCIAL CONGLOMERATE means the company under the Notification of the Bank of Thailand re: Consolidated Supervision, consisted of KBank, K Companies and subsidiaries operating in supporting KBank, Phethai Asset Management Co., Ltd. and other subsidiaries within the permitted scope from the BOT’s to be financial conglomerate Exchange rate at the end of September 2018 (Mid Rate) was Bt32.41 per USD (Source: Bank of Thailand)
Share Information
SET Symbol Share Capital: Authorized Bt30.5bn (USD0.9bn) Issued and Paid-up Bt23.9bn (USD0.7bn) Number of Shares 2.4bn shares Market Capitalization Bt464bn (USD14.0bn) Ranked #1 in Thai banking sector 3Q18 Avg. Share Price: KBANK Bt209.55 (USD6.47) KBANK-F Bt212.57 (USD6.56) EPS (9M18) Bt13.13 (USD0.41) BVPS Bt154.82 (USD4.78) KBANK, KBANK-F
Consolidated (as September of 2018)
Assets Bt3,054bn (USD94.3bn) Ranked #4 with 15.2% market share** Loans* Bt1,849bn (USD57.1bn) Ranked #4 with 15.0% market share** Deposits Bt1,921bn (USD59.3bn) Ranked #4 with 15.6% market share** CAR 18.96% *** ROE (9M18) 11.65% ROA (9M18) 1.41% Number of Branches 1,000 Number of ATMs 9,228 Number of K PLUS Users 9.4mn Number of Employees 20,599