
SLIDE 1
Joint Venture with Mapletree Investments to Acquire 10 Powered Shell - - PowerPoint PPT Presentation
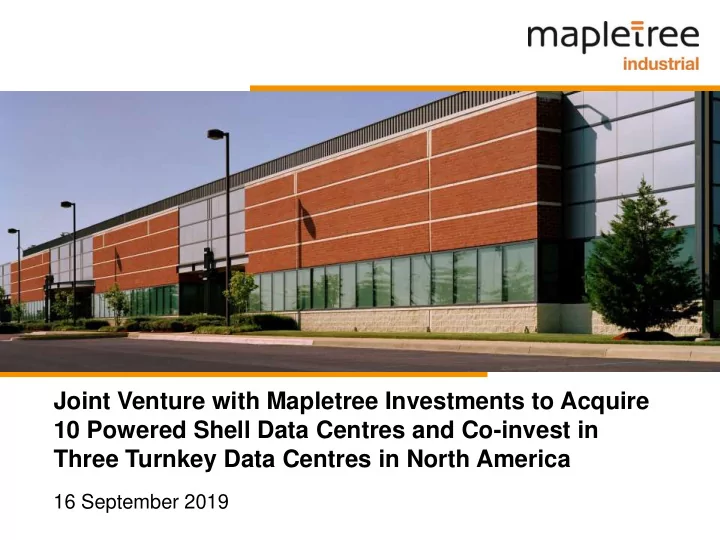
Joint Venture with Mapletree Investments to Acquire 10 Powered Shell Data Centres and Co-invest in Three Turnkey Data Centres in North America 16 September 2019 Important Notice NOT FOR PUBLICATION OR DISTRIBUTION, DIRECTLY OR INDIRECTLY, IN OR
2
NOT FOR PUBLICATION OR DISTRIBUTION, DIRECTLY OR INDIRECTLY, IN OR INTO THE UNITED STATES, EUROPEAN ECONOMIC AREA, CANADA, JAPAN OR AUSTRALIA This presentation should be read in conjunction with the announcement released by Mapletree Industrial Trust (“MIT”) on 16 September 2019 titled “Joint Venture with Mapletree Investments to Acquire US$1.4 billion Data Centre Portfolio in the United States and Canada. This presentation has been prepared by Mapletree Industrial Trust Management Ltd., as the manager of MIT (the “Manager”) for information purposes only and should not be used for any other purposes. The contents of this presentation have not been reviewed by any regulatory
guaranteed and it may not contain all material information concerning MIT. None of the Manager, MIT nor any of their respective affiliates, advisors and representatives or any of their respective holding companies, subsidiaries, affiliates, associated undertakings or controlling persons, or any of their respective directors, officers, partners, employees, agents, representatives, advisers (including any bookrunner and underwriter in respect of any equity fund raising that may be undertaken by the Manager) or legal advisers makes any representation or warranty, express or implied, and whether as to the past or the future regarding, and none of them assumes any responsibility or liability whatsoever (in negligence or
contained herein or therein, or for any loss howsoever arising whether directly or indirectly from any use, reliance or distribution of these materials or its contents or otherwise arising in connection with this presentation. Further, nothing in this presentation should be construed as constituting legal, business, tax or financial advice. None of Mapletree Investments Pte Ltd (the "Sponsor"), MIT, the Manager, DBS Trustee Limited (as trustee of MIT) or their respective subsidiaries, affiliates, advisors, agents or representatives have independently verified, approved or endorsed the material herein. This presentation contains forward-looking statements that involve assumptions, risks and uncertainties. Such forward-looking statements are based on certain assumptions and expectations of future events regarding MIT's present and future business strategies and the environment in which MIT will operate, and must be read together with those assumptions. Although the Manager believes that such forward-looking statements are based on reasonable assumptions, it can give no assurance that these assumptions and expectations are accurate, projections will be achieved, or that such expectations will be met. Actual future performance, outcomes and results may differ materially from those expressed in forward-looking statements as a result of a number of risks, uncertainties and assumptions. Representative examples of these risks, uncertainties and assumptions include (without limitation) general industry and economic conditions, interest rate trends, cost of capital and capital availability, competition from similar developments, shifts in expected levels of property rental income, changes in operating expenses including employee wages, benefits and training, governmental and public policy changes and the continued availability of financing in the amounts and the terms necessary to support future business. You are cautioned not to place undue reliance on these forward-looking statements, which are based on the Manager’s current view of future
These materials contain a summary only and do not purport to contain all of the information that may be required to evaluate any potential transaction mentioned in this presentation, including the proposed formation of joint ventures and acquisition of data centres by these joint ventures as described, which may or may not proceed. You should conduct your own independent analysis of the Sponsor, the Manager and MIT, including consulting your own independent legal, business, tax and financial advisers and other advisers in order to make an independent determination of the suitability, merits and consequences of investment in MIT. The value of Units in MIT and the income derived from them may fall as well as rise. Units are not obligations of, deposits in, or guaranteed by the Manager, or any of its affiliates. An investment in Units is subject to investment risks, including the possible loss of the principal amount invested. Investors have no right to request the Manager to redeem their Units while the Units are listed. It is intended that Unitholders may only deal in their Units through trading on the SGX-ST. Listing of the Units on the SGX-ST does not guarantee a liquid market for the Units. This presentation is for information only and does not constitute or form part of an offer, solicitation, recommendation or invitation for the sale or purchase of any securities of MIT in Singapore or any other jurisdiction nor should it or any part of it form the basis of or be relied upon in connection with any investment decision, contract or commitment whatsoever. This presentation is being provided to you for the purpose of providing information in relation to the forthcoming transaction by MIT. This presentation is not being distributed by, nor has it been approved for the purposes of section 21 of the Financial Services and Markets Act 2000 (“FSMA”) by, a person authorised under FSMA. This presentation is being communicated only to persons in the United Kingdom who are (i) authorised firms under the FSMA and certain other investment professionals falling within article 19 of the FSMA (Financial Promotion) Order 2005 (the "FPO") and directors, officers and employees acting for such entities in relation to investment; or (ii) high value entities falling within article 49 of the FPO and directors, officers and employees acting for such entities in relation to investment; (iii) persons to whom it may otherwise lawfully be communicated. The securities of MIT have not been and will not be registered under the United States Securities Act of 1933, as amended (the "Securities Act") or under the securities laws of any state or
requirements of the Securities Act and in compliance with any applicable state securities laws. The Manager does not intend to conduct a public offering of any securities of MIT in the United States. Neither this presentation nor any part thereof may be (a) used or relied upon by any other party or for any other purpose, (b) copied, photocopied, duplicated or otherwise reproduced in any form or by any means, or (c) forwarded, published, redistributed, passed on or otherwise disseminated or quoted, directly or indirectly, to any other person either in your organisation or
3
21745 Sir Timothy Drive (ACC9), Northern Virginia
5
Proposed Transaction 50:50 joint venture (“Singapore JV”) with Mapletree Investments (“MIPL”) to acquire 13 data centres in the US and Canada: 3 fully fitted hyperscale data centres (“Turnkey Portfolio”) 10 powered shell data centres (“Powered Shell Portfolio”) 80:20 joint venture between Singapore JV and Digital Realty to co-invest in the Turnkey Portfolio Purchase Consideration Singapore JV share: US$1,367.9 million (S$1,900.3 million1) MIT share: US$683.9 million (S$950.2 million) MIT Total Acquisition Cost2 US$694.5 million (S$965.0 million) Valuation3 100% Basis: US$1,625.0 million (S$2,257.6 million) Singapore JV share: US$1,416.4 million (S$1,967.8 million) MIT share: US$708.2 million (S$983.9 million) Vendor Digital Realty ("DLR") Proposed Funding Combination of equity and debt, with the final debt/equity structure to be decided at a later stage Target Completion Date Turnkey Portfolio (Late 2019) Powered Shell Portfolio (Early 2020)
1 Unless otherwise stated, an illustrative exchange rate of US$1.00 to S$1.38927 is used in this presentation. 2 Comprises MIT's proportionate share of the Purchase Consideration, estimated transfer taxes, professional and other fees and expenses in connection with the Proposed Acquisition respectively, as well as the acquisition fee payable to the Manager for the JV (1% of MIT's proportionate share of the Purchase Consideration) and other expenses in connection with MIT's investment in the JV 3 Independent valuations of the Powered Shell Portfolio and Turnkey Portfolio (on a 100% basis) as at 1 September 2019 by Newmark Knight Frank Valuation & Advisory, LLC. based on the sales comparison approach and income capitalisation approach. 4 Refers to the purchase consideration of Singapore JV.
50% Singapore JV Powered Shell Portfolio Turnkey Portfolio 50% 80% 20% 100% US$557.3m4 US$810.6m4
6
Turnkey Portfolio (US$810.6m)5 (Hyperscale Data Centres)
Northern Virginia Virginia
Drive (ACC10)
Drive (ACC9)
(ACC2)
Key Tenants (combined 51.7% of GRI1)
3 of the top 10 largest tech companies in the US2
Land Tenure4
94.1% Freehold
1 By proforma GRI based on Singapore JV’s 100% interest in the Powered Shell Portfolio and 80% interest in the Turnkey Portfolio (the “MRODCT Portfolio”) as at 1 April 2020. 2 Based on market capitalisation as at 31 August 2019. 3 Based on Weighted Average Lease Expiry ("WALE") by proforma GRI of the MRODCT Portfolio as at 1 April 2020. 4 Based on land area of MRODCT Portfolio. 5 Purchase Consideration of Singapore JV's 80% stake in the Turnkey Portfolio. 6 Purchase Consideration of the Powered Shell Portfolio. 12
Phoenix, Arizona
7
Denver, Colorado
8 4
Atlanta, Georgia Northern Virginia, Virginia
9 10 3 1 2 11
Dallas, Texas
6
Toronto, Ontario
13
Boston, Massachusetts
5
WALE3
9.1 years
Fixed Rental Escalations
≥2% p.a. for about 92.2% of leases
1 2 3
Powered Shell Portfolio (US$557.3m)6
Atlanta Georgia
Parkway Boston Massachusetts
Dallas Texas
Parkway Denver Colorado
Drive
Avenue Northern Virginia Virginia
Circle
Beaumeade Cicle
Boulevard Phoenix Arizona
Technology Circle Toronto Ontario
Occupancy
100.0%
5 9 8 7 6 4 13 10 11 12
7 Turnkey Portfolio Powered Shell Portfolio Target Portfolio Number of Assets 3 10 13 Land Area (million sq ft) 2.5 4.7 7.3 NLA (million sq ft) 0.7 1.4 2.1 Number of Tenants 4 5 9 Based on Singapore JV’s share Valuation US$834.4 million1 (~S$1,159.2 million) US$582.0 million (~S$808.6 million) US$1,416.4 million1 (~S$1,967.8 million) Purchase Consideration
US$810.6 million1 (~S$1,126.1 million) US$557.3 million (~S$774.2 million) US$1,367.9 million1 (~S$1,900.3 million)
1
Based on Singapore JV’s 80% interest in the Turnkey Portfolio.
2055 East Technology Circle, Phoenix
9
1 High Quality Portfolio with Strong Tenant Base 2 Acquisition is in line with MIT’s Strategy and Positions MIT to Capture Growth in the Data Centre ("DC") Sector 3 Joint Venture with Digital Realty – the 2nd Largest DC REIT and 10th Largest Publicly Traded REIT in the US 4 Strong Support from Sponsor with Aligned Interest 5 DPU and NAV per Unit Accretive
10
Trend towards outsourcing of IT facilities and services, and adoption of cloud services has led to the growth and development of HDCs HDCs have become critical infrastructure for the world's largest cloud services and technology companies, as well as corporates that are increasingly adopting cloud-based applications Cloud and data centre service providers are under pressure to add data centre space to keep up with the rapid growth of the global cloud computing market - expected to grow at 16.1% CAGR from 2017-2023F3
MRODCT Portfolio Breakdown by Valuation1 (%)
1 Based on Singapore JV’s 100% interest in the Powered Shell Portfolio and 80% interest in the Turnkey Portfolio as at 1 September 2019. 2 By proforma GRI as at 1 April 2020. 3 Source: 451 Research LLC, 1Q2019.
MRODCT Portfolio Breakdown by GRI2 (%)
Turnkey Data Centres (HDC) 58.9% Powered Shell Data Centres 41.1% Turnkey Data Centres (HDC) 57.5% Powered Shell Data Centres 42.5%
11
83.0% of the MRODCT Portfolio's GRI is derived from the Top 10 largest data centre markets in North America, of which 70.0% is from Northern Virginia – the largest data centre market globally
Top 10 Data Centre Markets in North America1 Net Operational sq ft (million sq ft) Contribution to the MRODCT Portfolio's GRI
Portfolio Northern Virginia 3 Turnkey (Hyperscale) 3 Powered Shell New York/New Jersey Dallas 1 Powered Shell Silicon Valley Chicago Los Angeles Atlanta 1 Powered Shell Phoenix 1 Powered Shell Las Vegas Toronto 1 Powered Shell
1 Source: 451 Research LLC, 1Q2019 (based on net operational sq ft).
1.7 1.7 1.8 2.4 2.5 3.5 3.7 4.6 4.7 8.7 2.3% 3.2% 6.6% 0.9% 70.0%
12
MRODCT Portfolio Tenants GRI Contribution (%) Pre-Acquisition: Top 10 Tenants GRI Contribution3 (%) Post-Acquisition: Top 10 Tenants GRI Contribution2 (%) HP HP AT&T Global Social Media Company STT Tai Seng Global Colocation Provider Equinix AT&T Sivantos STT Tai Seng Life Technologies Equinix Celestica Fortune 25 Investment Grade-Rated Company Kulicke & Soffa Sivantos DC Tenant4 IT Solutions Provider Qualcomm Life Technologies 0.9% 1.2% 1.2% 1.2% 1.3% 1.8% 2.6% 2.7% 3.2% 9.2%
1 Based on market capitalisation as at 31 August 2019. 2 By pro forma GRI based on MIT's portfolio as at 30 June 2019 and assuming that the Proposed Acquisition is completed on 1 April 2020. 3 As at 30 June 2019. 4 The identity of the tenant cannot be disclosed due to the strict confidentiality obligations under the lease agreement.
3 of the top 10 largest1 technology companies in the US contribute 51.7% of the MRODCT Portfolio's GRI Tenants include some of the world's most valuable and fastest-growing software, social networking, cloud computing, consumer electronics and colocation companies Diversifies MIT's tenant base and reduces exposure to any single tenant from 9.2% to 8.0%2
Existing Portfolio MRODCT Portfolio 1.1% 1.1% 1.6% 1.7% 2.3% 2.4% 2.8% 3.5% 4.1% 8.0% Other Tenants 14.8% IT Solutions Provider 6.9% Fortune 50 Software Company 7.4% Fortune 25 Investment Grade-Rated Company 13.0% Global Social Media Company 31.3% Global Colocation Provider 26.6%
13
Flatted Factories Hi-Tech Buildings US Data Centres Business Park Buildings Stack-up/Ramp-up Buildings Light Industrial Buildings Target Portfolio 12.3% 24.1% 18.7% 14.4% 30.5% FY19/20 FY20/21 FY21/22 FY22/23 FY23/24 & Beyond 10.7% 21.2% 16.2% 13.3% 38.6% FY19/20 FY20/21 FY21/22 FY22/23 FY23/24 & Beyond
The MRODCT Portfolio's WALE is 9.1 years1, with over 39.6% of leases with expiries beyond 10 years, and another 45.2% with expiries between 5 to 10 years About 91.5% of the MRODCT Portfolio's GRI1 is derived from triple net leases About 92.2% of the MRODCT Portfolio's leases1 have fixed rental escalations of ≥2% p.a.
Post-Acquisition: Lease Expiry Profile3
3.4 years WALE2 4.1 years WALE3
1 By proforma GRI of the MRODCT Portfolio as at 1 April 2020. 2 By GRI as at 30 June 2019. 3 By pro forma GRI based on MIT's portfolio as at 30 June 2019 and assuming that the Proposed Acquisition is completed on 1 April 2020.
Pre-Acquisition: Lease Expiry Profile2
MRODCT Portfolio
14
2.2% 13.8% 10.5% 8.0% 36.1% 5.4% 24.0% 1.8% 11.1% 8.4% 6.4% 28.9% 5.5% 37.9% 0 to 10 years >10 to 20 years >20 to 30 years >30 to 40 years >40 to 50 years More than 50 years Freehold Existing Portfolio Enlarged Portfolio
12 out of the 13 Properties in the MRODCT Portfolio are sited on freehold land1; 94.1%2 of the MRODCT Portfolio (by land area) is freehold Post-Acquisition, MIT's proportion of freehold assets will increase significantly from 24.0% to 37.9%2
Remaining Years to Expiry on Underlying Land Leases (by Land Area)
1 All Properties are sited on freehold land, except 2055 East Technology Circle, Phoenix, which has a remaining land lease tenure of about 64.3 years as at 30 June 2019. 2 Based on MIT's proportion of the land area of the MRODCT Portfolio. 3 As at 30 June 2019. 3
15
Asia Pacifc 37% United States 32% Rest of North America 2% Europe 23% Latin America 5% Middle East & Africa 1%
Data Centre Space by Region2
718 737 756 774 792 812 833 222 250 282 315 349 381 415 2017 2018 2019F 2020F 2021F 2022F 2023F Insourced Outsourced
Worldwide Data Centre Space1
1 Source: 451 Research LLC. Insourced data centre space refers to enterprise-used data centre space. Outsourced data centre space comprises leased and cloud provider-owned data centre space. 2 Source: 451 Research LLC as at 1Q2019. Based on net operational sq ft.
Global demand for data centres is being driven by explosive growth in data and cloud computing Insourced and outsourced data centres are expected to grow at a CAGR of 4.9% from 2017-2023F1 The Proposed Acquisition deepens MIT's presence in the US – the single largest and most established data centre market in the world, accounting for 32% of data centre space globally2
Net Operational Sq Ft (million) 1,248 940 1,193 1,141 1,089 1,038 987
16
Flatted Factories 27.4% Business Park Buildings 10.1% Stack-up / Ramp-up Buildings 8.2% Light Industrial Buildings 1.4%
Increases MIT's exposure to Hi-Tech Buildings from 43.5%1 to 52.9% Increases MIT's exposure to overseas data centres from 9.1%1 to 24.3% In line with the Manager's target for overseas data centres to comprise ~30% of MIT's AUM2
Hi-Tech Buildings 43.5% Flatted Factories 32.9% Business Park Buildings 12.1% Stack-up / Ramp-up Buildings 9.9% Light Industrial Buildings 1.6%
1 As at 30 June 2019. 2 Subject to periodic review by the Manager. 3 Based on MIT’s book value of investment properties and investment properties under development as at 30 June 2019. 4 Based on MIT’s book value of investment properties and investment properties under development as at 30 June 2019 and MIT Total Acquisition Cost.
8.6% 9.1% 24.3% Data Centres: 31.5% US & Canada: 24.3% SG: 7.2% Data Centres: 17.7% US: 9.1% SG: 8.6%
AUM3: S$4.8bn
Pre-Acquisition: Portfolio Breakdown3 AUM4: S$5.8bn
Post-Acquisition: Portfolio Breakdown4
7.2% Hi-Tech Buildings 52.9%
Singapore United States 90.9% 9.1% Singapore United States and Canada 75.7% 24.3%
17
DLR is a leading data centre REIT in the US DLR will continue to provide property management services for the Turnkey Portfolio. In addition, DLR will provide property management services for the Powered Shell Portfolio for a one-year transition period Alignment of interest via the 20% stake in the Turnkey Portfolio Potential for future collaboration and synergies across the US and other markets
1 By market capitalisation as at 31 August 2019 2 FTSE NAREIT Equity REITs (FNER) Index; for the period between 29 October 2004 and 31 August 2019; prices rebased to 100 as of 29 October 2004
and 14 countries
100 200 300 400 500 600 700 800 900 1,000 1,100 Oct-04 Oct-06 Oct-08 Oct-10 Oct-12 Oct-14 Oct-16 Oct-18 Digital Realty Trust FTSE NAREIT US Real Estate
DLR share price performance vs NAREIT Index2
DLR: +930% NAREIT: +93%
18
1
California Arizona
1
Denver
2
Texas
1 3
Georgia
3 1
Tennessee
1 2
North Carolina
6
Wisconsin
1 1
Michigan
1
Ontario
1 1
Pennsylvania Massachusetts New Jersey
1
Virginia
Sponsor's participation underscores its commitment to grow and support MIT As at 31 March 2019, the Sponsor owns and manages S$55.7bn of assets across APAC, North America and Europe, of which S$9.8bn is located in North America The Sponsor has granted MIT a ROFR to acquire its 50% interest in MRODCT. Combined with the ROFR to acquire the Sponsor’s 60% interest in MRDCT1, these provide significant investment pipeline
Target Portfolio (13 data centres) MRDCT Portfolio1 (14 data centres) *Number of data centres indicated in the circles 1 Acquired the 14 data centres in the MRDCT Portfolio through a 60:40 Joint Venture between MIPL and MIT. M 5 Bryant Park, 28th Floor, New York, NY 10018 125 S. Clark St.,17th Floor, Chicago, IL 60603 1 World Trade Center, 24th Floor Long Beach, CA 90831 M M M 180 Peachtree Street, Suite 610 Atlanta, GA 30303 M 2033 Chenault Dr, Suite 136 Carrollton, TX 75006 M MIPL Sponsor's Offices in the US
19 1.51 1.56
FY18/19¹ Pro Forma FY18/19 NAV per Unit After Joint Venture and Proposed Acquisition²
Pro Forma NAV per Unit as at 31 March 2019 After Joint Venture and Proposed Acquisition4,5
Distribution Per Unit Singapore cents
1 For the financial year ended 31 Mar 2019. 2 For illustrative purposes only, the pro forma financial effects of the Joint Venture and Proposed Acquisition on MIT's DPU for FY18/19, as if the Joint Venture, Proposed Acquisition and issue of New Units were completed on 1 April 2018, and as if the Properties were held and operated through to 31 March 2019. 3. Includes (a) the illustrative 157,304,000 New Units issued at the Illustrative Issue Price of S$2.250 and (b) approximately 927,018 new Units issued to the Manager as payment of 50% base fee in relation to the services rendered to the Properties for the periods 1 April 2018 to 30 June 2018, 1 July 2018 to 30 September 2018, and 1 October 2018 to 31 December 2018, based on the historical issue price of management fees for MIT's existing portfolio paid in Units for such quarter 4. Includes MIT’s proportionate share of 50.0% of the NAV of MRODCT. 5. Includes the illustrative 157,304,000 New Units issued at the Illustrative Issue Price of $2.250.
Net Asset Value Per Unit S$ 12.16 12.58
FY18/19¹ Pro Forma FY18/19 DPU After Joint Venture and Proposed Acquisition²
Pro Forma FY18/19 DPU After Joint Venture and Proposed Acquisition1,2,3 FY18/19 As at 31 March 2019
21110 Ridgetop Circle, Northern Virginia
21 Funding Requirements Purchase Consideration3 US$683.9m (S$950.2m) Transaction Cost4 US$3.5m (S$4.9m) Acquisition Fee5 US$6.8m (S$9.5m) Other Expenses in relation to Joint Venture6 US$0.3m (S$0.4m) MIT Total Acquisition Cost US$694.5m (S$965.0m) MIT Total Acquisition Cost
Acquisition to be funded by a combination of debt and equity The following assumptions regarding the methods of financing are for illustrative purposes only Estimated equity: ~US$250.7m1 (S$348.2m) (~36.1% of MIT Total Acquisition Cost) About 60% to be funded by debt
1
This assumes the issue of an illustrative 157,304,000 New Units at an illustrative issue price of S$2.250 per new Unit.
2
In accordance with Property Funds Guidelines; the aggregate leverage ratio includes proportionate share of borrowings of the Joint Venture and deposited property values
3
Based on MIT’s 50% interest in the Singapore JV.
4
Refers to cost incurred by the Singapore JV.
5
1.0% of MIT’s proportionate share of the purchase consideration.
6
Refers to other expenses in connection with MIT’s investment in the Singapore JV.
Debt Equity ~US$443.8m (S$616.8m) ~US$250.7m1 (S$348.2m)
For Illustrative Purposes Total = US$694.5m (S$965.0m) Post-acquisition, MIT’s pro forma aggregate leverage is expected to increase to 38.5%2 from 33.4% as at 30 June 2019
22
Independent Valuation Purchase Consideration
1 Independent valuations as at 1 September 2019 by Newmark Knight Frank Valuation & Advisory, LLC. based on the sales comparison approach and income capitalisation approach. 2 Based on Singapore JV’s 100% interest in the Powered Shell Portfolio and 80% interest in the Turnkey Portfolio.
3.4% discount Purchase Consideration Relative to Independent Valuation (US$ million) US$1,416.4m US$1,367.9m Independent Valuation1,2 Purchase Consideration
44490 Chilum Place (ACC2), Northern Virginia
24
Acquisition in line with MIT's strategy, positioning MIT to capture growth in the DC sector of through portfolio with a high proportion of HDCs JV with DLR - the 10th largest publicly traded REIT in the US – and fully aligned Sponsor allows MIT to leverage their expertise, resources and network Focused on the top United States data centre markets Primarily leased out on triple net leases with minimal leasing risk Increases proportion of freehold assets from 24.0% to 37.9% Adds quality tenants, including 3 of the 10 largest tech companies in the US Increases stability of cash flow due to 9.1 year WALE and fixed escalations DPU and NAV per Unit accretive to Unitholders Increases Hi-Tech Buildings segment to over half of the enlarged portfolio Increases exposure to the fast-growing outsourced data centre market ROFR on Sponsor's stake in two joint ventures provides significant investment pipeline Deepens presence in key data centre markets in North America Provides exposure to the high growth HDC sector Collaboration with Digital Realty – 2nd largest DC REIT in the US Prudent and measured expansion through 50:50 JV with the Sponsor
21561 – 21571 Beaumeade Circle, Northern Virginia
26
Location 21745 Sir Timothy Drive, Northern Virginia 21744 Sir Timothy Drive, Northern Virginia 44490 Chilum Place, Northern Virginia Property Type Turnkey Turnkey Turnkey Land Area (sq ft) 819,744 721,354 962,748 NLA (sq ft) 327,847 289,000 87,000 Occupancy 100.0% 100.0% 100.0% Valuation US$473.0 million** US$433.0 million** US$137.0 million** 21744 Sir Timothy Drive (ACC10) 21745 Sir Timothy Drive (ACC9) 44490 Chilum Place (ACC2)
* Properties are arranged in descending order by valuation. ** Based on 100% interest in the Property.
27
11900 East Cornell Avenue 375 Riverside Parkway 45901-45845 Nokes Boulevard Location 11900 East Cornell Avenue, Denver 375 Riverside Parkway, Atlanta 45901-45845 Nokes Boulevard, Northern Virginia Property Type Powered Shell Powered Shell Powered Shell Land Area (sq ft) 425,580 1,393,610 533,774 NLA (sq ft) 285,176 250,191 167,160 Occupancy 100.0% 100.0% 100.0% Valuation US$102.0 million US$94.0 million US$71.0 million
* Properties are arranged in descending order by valuation.
28
21110 Ridgetop Circle 115 Second Avenue 21561-21571 Beaumeade Circle Location 21110 Ridgetop Circle, Northern Virginia 115 Second Avenue, Boston 21561-21571 Beaumeade Circle, Northern Virginia Property Type Powered Shell Powered Shell Powered Shell Land Area (sq ft) 369,922 127,452 616,338 NLA (sq ft) 135,513 66,730 164,453 Occupancy 100.0% 100.0% 100.0% Valuation US$59.0 million US$56.0 million US$55.0 million
* Properties are arranged in descending order by valuation.
29
2055 East Technology Circle 8534 Concord Center Drive Location 8534 Concord Center Drive, Denver 2055 East Technology Circle, Phoenix 6800 Millcreek, Toronto Property Type Powered Shell Powered Shell Powered Shell Land Area (sq ft) 213,119 395,501 261,505 NLA (sq ft) 85,660 76,350 83,758 Occupancy 100.0% 100.0% 100.0% Valuation US$51.0 million US$47.0 million US$35.0 million
* Properties are arranged in descending order by valuation.
6800 Millcreek
30
Location 17201 Waterview Parkway, Dallas Property Type Powered Shell Land Area (sq ft) 410,024 NLA (sq ft) 61,750 Occupancy 100.0% Valuation US$12.0 million
* Properties are arranged in descending order by valuation.
17201 Waterview Parkway
For enquiries, please contact Ms Melissa Tan, Director, Investor Relations, DID: (65) 6377 6113, Email: melissa.tanhl@mapletree.com.sg