
SLIDE 1
JACK CINCINNATI CASINO TRANSACTION OVERVIEW APRIL 5, 2019 - - PowerPoint PPT Presentation
JACK CINCINNATI CASINO TRANSACTION OVERVIEW APRIL 5, 2019 DISCLAIMERS Forward-Looking Statements This presentation contains forward-looking statements within the meaning of the federal securities laws. You can identify these statements by our
2
Forward-Looking Statements This presentation contains forward-looking statements within the meaning of the federal securities laws. You can identify these statements by our use of the words “assumes,” “believes,” “estimates,” “expects,” “guidance,” “intends,” “plans,” “projects,” and similar expressions that do not relate to historical matters. All statements other than statements of historical fact are forward-looking
cases, beyond the control of VICI Properties Inc. and its subsidiaries (collectively, the “Company” or “VICI”) and could materially affect actual results, performance, or achievements. Among those risks, uncertainties and other factors are risks that the acquisition of the JACK Cincinnati Casino may not be consummated on the terms or timeframe described herein, or at all; the ability of the parties to satisfy the conditions set forth in the definitive transaction documents, including the ability to receive, or delays in obtaining, the regulatory approvals required to consummate the transaction; the terms on which the Company finances the transaction, including the source of funds used to finance such transaction; disruptions to the real property and operations of the JACK Cincinnati Casino during the pendency of the closing; risks that the Company may not achieve the benefits contemplated by the acquisition of the real estate assets (including any expected accretion or the amount of any future rent payments); and risks that not all potential risks and liabilities have been identified in the due diligence. Additional important factors that may affect the Company’s business, results of
Company’s other filings with the Securities and Exchange Commission. The Company does not undertake any obligation to update or revise any forward-looking statement, whether as a result of new information, future events, or otherwise, except as may be required by applicable law. Market and Industry Data This presentation contains estimates and information concerning the Company's industry and certain relevant markets, including macroeconomic data and gross gaming revenue, that are based on industry publications, reports and public filings. This information involves a number of assumptions and limitations, and you are cautioned not to rely on or give undue weight to this information. The Company has not independently verified the accuracy or completeness of the data contained in these industry publications, reports or filings. The industry in which the Company operates is subject to a high degree of uncertainty and risk due to variety of factors, including those described above under “Forward-Looking Statements.” Non‐GAAP Financial Measures This presentation includes reference to Adjusted Funds From Operations (“AFFO”), and Adjusted EBITDARM, which are not required by, or presented in accordance with, generally accepted accounting principles in the United States (“GAAP”). These are non‐GAAP financial measures and should not be construed as alternatives to net income or as an indicator of operating performance (as determined in accordance with GAAP). We believe AFFO provides a meaningful perspective of the underlying operating performance of our business. We use Adjusted EBITDARM to evaluate the capacity of the tenant under the lease agreement for the JACK Cincinnati Casino to meet its obligations thereunder. These non-GAAP financial measures: (i) do not represent cash flow from operations as defined by GAAP; (ii) should not be considered as an alternative to net income as a measure of operating performance or to cash flows from operating, investing and financing activities; and (iii) are not alternatives to cash flow as a measure of liquidity. In addition, these measures should not be viewed as measures of liquidity, nor do they measure our ability to fund all of our cash needs, including our ability to make cash distributions to our stockholders, to fund capital improvements, or to make interest payments on our indebtedness. Investors are also cautioned that Adjusted EBIDTARM, as presented, may not be comparable to similarly titled measures reported by other real estate companies, including REITs due to the fact that not all real estate companies use the same definitions. Our presentation of these measures does not replace the presentation of our financial results in accordance with GAAP.
3
JACK Cincinnati opened in 2013 and is
permitted to operate slot machines and table games1
#1 asset in the Cincinnati / Dayton Market2
New, centrally located urban asset
space and 6 dining options
Increases VICI’s geographic diversity
Strong macroeconomic drivers in Ohio include a diverse economy and steady employment growth
Ohio, a new regional gaming market, continues to grow at a healthy pace
Transaction creates a new tenant partnership with Hard Rock International (“Hard Rock” or “HRI”)
Founded in 1971, HRI is a globally recognized owner, operator and franchiser of cafes, hotels and casinos in 75 countries
Hard Rock maintains an investment grade rating
Attractive acquisition cap rate of 7.7%
Transaction is immediately accretive to AFFO and is expected to be leverage neutral
Newly built urban real estate asset on 22 acres with minimal future capex required
Third tenant partnership formed in less than two years since formation, demonstrating VICI’s success in diversifying its tenant base
Meaningful increase to annual rental revenue and NOI
Favorable annual escalator to drive organic growth
Source: Ohio Casino Control Commission, Hard Rock International 1. The state of Ohio is limited by its constitution to have only four casino facilities with table games. However, there are currently seven racino gaming facilities in the state operating video lottery terminals. 2. Based on YE 2018 GGR performance.
4
1.7x $42.75 million 13.05x 7.7% $72.1 million $2.3 million $745 million ($558 million PropCo / $187 million OpCo)
Subsidiary of Hard Rock
1. LTM as of February 28, 2019, does not include anticipated OpCo synergies. Management fees are assumed to be eliminated at transaction close. See page 9 of this presentation for a reconciliation to the most comparable GAAP financial measure. 2. No assurance can be given that such anticipated synergies will be achieved by the OpCo in the timeframes expected, or at all. 3. Excluding OpCo synergies. 4. Unless CPI is < 0.5%, then there is no annual escalator.
Initial 15-year term Followed by 4 five-year renewal options 1.5% in years 2-4 The greater of 2.0% or CPI beginning in year 54 Seminole Hard Rock Entertainment, Inc. PropCo Multiple Implied RE Cap Rate LTM Adj. EBITDARM1
Pro Forma Rent Coverage3 Initial Rent Purchase Price Tenant Guarantor Lease Term Escalator Summary
5
~16,200 Hotel Rooms in 27 Hotels 22,800 Gaming Positions Across 12 Casinos 30 Upcoming Hotel Locations 245 Branded Hard Rock Venues in 75 Countries 40,000 System Wide Employees
Source: HRI website 1. As of year-end 2018 (includes Rocksino Northfield Park, which was subsequently acquired by MGM Resorts). 2. The Seminole Tribe owns the Hard Rock branded casinos in Hollywood and Tampa, Florida. In addition, the Seminole Tribe owns and operates four Seminole Casinos in Florida.
Founded in 1971, Hard Rock has developed a leading global presence and is one of the world’s most recognized brands
Hard Rock Seminole Location2 Hard Rock Hotel & Casino Atlantic City Hard Rock Hotel & Casino Biloxi Seminole Hard Rock Hotel & Casino Hollywood Hard Rock Hotel & Casino Las Vegas Hard Rock Ottawa Casino Hard Rock Hotel & Casino Sacramento Hard Rock Hotel & Casino Sioux City Seminole Hard Rock Hotel & Casino Tampa Hard Rock Hotel & Casino Tulsa Hard Rock Casino Vancouver Hard Rock Hotel & Casino Lake Tahoe Upcoming Hard Rock Location
Holdings, LLC, and owns the trademark for all Hard Rock brands
worldwide — Top branded destinations include HRI’s two most successful hotel and casino properties in Tampa2 and Hollywood, Florida2, as well as properties in Atlantic City, Bali, Cancun and Ibiza
including in London, New York, San Francisco, Sydney and Dubai
highest grossing gaming facility in the state
Hard Rock has achieved investment grade ratings from both S&P and Fitch. The gaming division of Hard Rock's ultimate beneficial owner is one of the strongest credit rated gaming companies in the world and maintains an investment grade rating from all three agencies
Standard & Poor’s BBB- Moody’s Ba2 Fitch BBB-
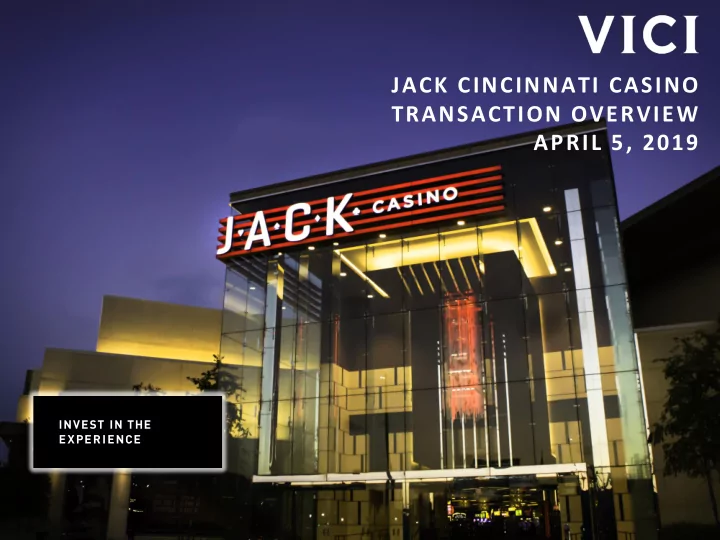
6 Six distinctive and diverse dining options, including an upscale, full-service restaurant
JACK Cincinnati opened in March 2013 in Cincinnati’s central business district near local attractions and major transportation options JACK Entertainment’s continual investment in JACK Cincinnati enhanced the high quality asset, reducing the need for future capex Property includes several event spaces, such as conference rooms, banquet space and a one-acre event lawn Additional acreage provides the potential to further expand the property JACK Cincinnati is the only full-scale casino within a 26-mile radius and the
Asset represents the 2nd largest investment
Includes a five-story, 2,500 space parking garage attached to the facility 450,000 square foot facility, serving a widespread customer base
JACK Entertainment’s
Net Revenues $ 218.8
$ 72.1 Margin 32.9 %
($ in millions) 1. LTM as of February 28, 2019. 2. LTM as of February 28, 2019, does not include anticipated OpCo synergies. Management fees are assumed to be eliminated at transaction close. See page 9 of this presentation for a reconciliation to the most comparable GAAP financial measure.
7
17% 16% 13% 11% 10% 10% 9% 8% 7%
Casino gaming was legalized in Ohio by amending the Ohio Constitution in 2009 Favorable competitive environment with no new gaming licenses expected and only a limited number currently available (4 casino licenses and 7 video lottery terminal facilities licensed)1 — Toledo, Cincinnati, Cleveland and Franklin County (Columbus) are each authorized to have one casino facility
Ohio has quickly become one of the largest regional gaming markets with $1.9bn of GGR in 2018 The Cincinnati MSA includes over 2 million residents with increasing population density in downtown Cincinnati Ohio has strong macroeconomic drivers, including employment growth and a diverse economy Total employment in Ohio is expected to increase 5.3% from 2014 – 2024, a projected gain of 300,000 jobs
($ in millions)
Market Highlights Attractive GGR Growth in New Gaming Market
4,900 5,000 5,100 5,200 5,300 5,400 5,500 5,600 5,700 0.0 % 2.0 % 4.0 % 6.0 % 8.0 % 10.0 % 12.0 % Jan-08 Jul-11 Feb-15 Sep-18 # of Employees (000s) Unemployment Rate Unemployment Rate # of Employees (000s)
Ohio Employment Growth Ohio GDP By Sector (2017)
Manufacturing Transportation & Trade Business Services Government Education & Health Real Estate Other Services Finance & Insurance Agriculture, Mining, Construction, Utilities Source: U.S. Bureau of Labor Statistics, U.S. Bureau of Economic Analysis, Ohio Development Services Agency, Ohio Casino Control Commission 1. The state of Ohio is limited by its constitution to have only four casino facilities with table games. However, there are currently seven racino gaming facilities in the state operating video lottery terminals. In addition to state gaming taxes, racino facilities are required to contribute 9-11% of gaming revenue to Ohio Horsemen’s Associations.
Regulatory Highlights
$ 430 $ 1,070 $ 1,458 $ 1,644 $ 1,691 $ 1,776 $ 1,863 2012 2013 2014 2015 2016 2017 2018
8
JACK Cincinnati
Initial Cash Rent $42.75 million Annual Escalator 1.5% in years 2-4 > of 2.0% or CPI beginning in year 5, unless CPI is < 0.5%, then no annual escalator Rent Resets Year 8: 80% Base / 20% Variable Rental Reset 4% of net revenue increase / decrease Year 8: Average of years 5-7 less average of years 1-3 Term 15-year initial term with four 5-year renewal options Guarantee Seminole Hard Rock Entertainment, Inc. Capex Minimum 1.0% of net revenues
9
($ in millions) Twelve Months Ended February 28, 2019
Net Income $39.8 Interest Expense, Net of Interest Capitalized 3.1 Depreciation and Amortization 21.5 Management Fees 7.8 Gain on Disposal of Assets (0.1) Other 0.1 Adjusted EBITDARM1 $72.1 Year 1 Annual Rent 42.75 Pro Forma Rent Coverage 1.7x
Source: JACK Management 1. Does not include anticipated OpCo synergies.