
SLIDE 1
August 2020
Investor Update
TSX : SES | secure-energy.com
Investor Update TSX : SES | secure-energy.com SECURE ENERGY - - PowerPoint PPT Presentation
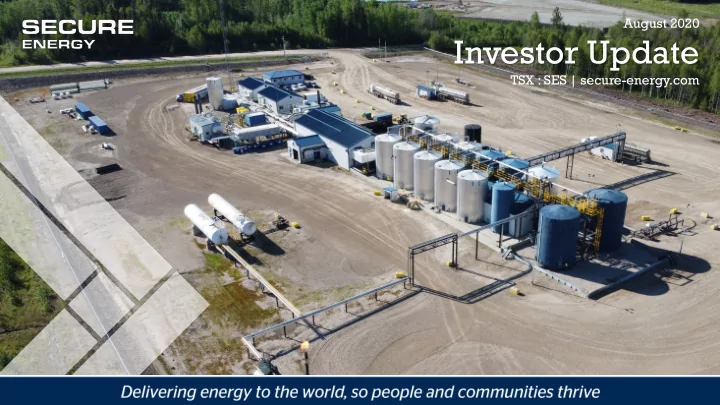
August 2020 Investor Update TSX : SES | secure-energy.com SECURE ENERGY Overview Delivering customer-focused solutions to upstream oil and natural gas 158.5 $265 companies across Western Canada and the U.S. Common Shares Market The two
August 2020
TSX : SES | secure-energy.com
2
Common Shares Outstanding (millions )(1)
Market Capitalization (millions)(1,2)
Enterprise Value (billions)(1,2,3)
Dividend Yield
Annualized Dividend per Share
Free Cash Flow Yield (1)(2)(4)
Delivering customer-focused solutions to upstream oil and natural gas companies across Western Canada and the U.S. » The two operating business segments are:
Midstream Infrastructure:
Environmental and Fluid Management:
» Strong management team with a proven track record since inception in 2007
(1) Common shares outstanding as June 30, 2020. (2) Based on share price as at June 30, 2020 of $1.67 per share. (3) Debt as at June 30, 2020. (4) Calculated as trailing twelve month Adjusted EBITDA less interest and sustaining capital expenditures as at June 30, 2020 as a percentage of Market Capitalization (1,2). Refer to Non-GAAP measures.
3
» SECURE’s key strategic priorities for 2020 are to:
communities
balance sheet by maximizing cash flows and monitoring credit exposure
cost structure with expected industry activity
expenses expected on an annualized basis based on measures taken to June 30, 2020
innovative midstream and environmental solutions that reduce their costs, lower emissions, and improve safety
Tony Creek Water Disposal Facility
» Maintain financial resiliency and balance sheet strength
4
Fund the Business Return Capital to Shareholders Repay Debt Fund Infrastructure Growth Dividend Growth Repurchase Shares » Capital deployment backed by contracted or highly reliable volumes with high quality counterparties » NCIB in place for flexibility to return surplus cash flows to shareholders via share buybacks » Long-term dividend growth to shareholders driven by free cash flows and capital growth opportunities
» Two lien structured credit facility totaling $730 million of capacity
June 2023
July 2021
lien facility syndicate
an extension of the second lien facility
» 3.2x Total Debt to EBITDA, well within the 5.0x covenant restriction » $75 million letter of credit facility also available
5
$0 $100 $200 $300 $400 $500 $600 $700 2020 2021 2022 2023 2024 (Millions)
Long-Term Debt Maturities
Total Facility Drawn at June 30, 2020
» Partnerships with customers to share midstream infrastructure
» Economies of scale achieved from aggregating multiple customer production volumes
6
Strategically located midstream processing facilities and pipelines in high impact resource plays
7
Kerrobert Pipeline System & Storage » Light oil feeder pipeline system and receipt terminal in the Kindersley-Kerrobert region » Contracted volumes with anchor tenants for a 10-year term » 420,000 barrels of storage capacity » Nearly 1.9 million cubic metres shipped in 2019 with zero environmental or safety incidents or unscheduled downtime Cushing Crude Oil Storage » Strategic entry into Cushing market through two tuck-in acquisitions:
to develop additional midstream infrastructure with strategic partners
» Owning crude oil storage infrastructure provides customers with market access flexibility to optimize realized pricing
8
» 120 kilometre gathering pipeline with 15,000 bbl/d initial capacity » Operational July 1, 2020 » Committed volumes with multiple producers for a 15-year term
9 East Kaybob Oil Pipeline Construction
» Increased utilization and efficiencies expected at SECURE’s existing Fox Creek FST » Creates value for our customers by providing capital efficient transportation, eliminating trucking constraints and reducing CO2 emissions New pipeline system supporting long-term growth strategy of expanding midstream infrastructure through customer partnerships
» Produced water management has become a major focus for producers
infrastructure
» Third-party water infrastructure is more efficient, offers capital savings, operational efficiencies, and safe and environmentally responsible disposal
10
Producer Owned Water Disposal SECURE ENERGY
Producer expertise Water transportation and disposal expertise Diverts capital away from core business – not always the highest rate of return Larger initial build-out provides economies of scale and more efficient use of capital Smaller initial build out Diversity of customers enhances productivity and provides higher asset utilization Lower utilization when not shared with multiple parties Lower volume volatility Higher volume volatility Aggregating volumes from multiple producers reduces redundancy, lowering overall cost and environmental impact
Finding a produced water solution is critical for customers’ drive to lowering costs and maximizing returns
For SECURE ENERGY
» Long-term committed volumes result in a reliable rate of return on our capital investment » Reliable volumes at the disposal facility result in more predictable, stable cash flows » Area dedication offers significant upside potential
11
For our customers
» Reduced operating costs » Allows capital to be invested where it generates the highest returns » Helps achieve customer objectives of responsible, sustainable development
For the public
» Eliminating the need to haul product by truck both increases safety for all road users and reduces greenhouse gas emissions » In 2019, produced water shipped by pipeline to the Gold Creek facility displaced over 7,000 truck loads, reducing CO2e emissions by 6,600 tonnes
The benefits of pipeline connecting produced water volumes are extensive
SECURE’s Gold Creek facility has the capacity for 3,500 m3 per day of produced water to be received by pipeline
Gold Creek Produced Water Pipeline and Disposal Facility
12
DRILLING
COMPLETIONS
solutions PRODUCTION & STIMULATION
fluids
WELL ABANDONMENT & FACILITY DECOMMISSION
waste/hazardous materials)
Helping producers transition to the highest ESG standards in the world
» Providing services related to:
13
Offering landfill disposal and a full suite of solutions including onsite abandonment, decommissioning, remediation and reclamation
» Network of industrial landfill disposal sites » Long-term contracts with three oil sands producers in the Fort McMurray area » Customer recognized safety excellence
Management
management solutions
Remediation Project in Alberta
14
Types of Landfill Waste Received:
Engineered Industrial landfill cells have a high-quality, multi-layer liner, liner protections system and environmental monitoring programs
Production Chemicals & EOR » Industry leading products: flow assurance, asset integrity, production optimization » Over 350 fully formulated proprietary products » Creating new products in our research labs » Leveraging midstream customer base to accelerate market share growth » Provides recurring revenue stream Drilling Fluids and Equipment » Multiple patents, innovative chemical solutions, customized drilling fluid programs » Technical expertise in long and deep horizontal wells drilling fluid systems » Fleet of “large bowl” solids control equipment matched with drilling fluid programs
15 Lab and Warehouse in Blackfalds, AB
» New $1.7 billion Government of Canada stimulus package announced in April to fund clean-up of
» Increased abandonment and remediation activity expected to positively impact all Canadian business units
reclamation
16
Federal program to accelerate orphan and inactive oil and gas well abandonments presents significant
» 2020 growth and expansion capital spend of approximately $50 million:
capabilities and increase processing and disposal capacity at existing facilities
» $10 million sustaining capital » Preliminary 2021 capital program of $15 million comprised primarily of sustaining capital
17
Continued midstream growth supported underpinned by long-term contracts
East Kaybob Pipeline System
18
» Stable cash flows provided by contracted volumes associated with oil feeder pipelines and pipeline-connected produced water disposal facilities » Significant crude oil storage opportunities at Kerrobert and Cushing due to volatile crude oil markets » Cost reduction initiatives realized beginning in Q2 2020 » Government subsidies received in the second quarter offsetting wage expense » Minimal drilling and completion activity in the second quarter of 2020 » Short-term production shut-ins
» Limited marketing opportunities due to low oil and liquids pricing
Kerrobert Terminal
SECURE recorded Adjusted EBITDA of $62.5 million for the six months ended June 30, 2020, driven by recurring production-based revenues
Cost reduction initiatives undertaken to protect free cash flow throughout the downturn: » Reduced personnel costs by approximately 25%, to levels consistent with anticipated activity levels
annualized basis » Reduced annual dividend from $0.27 to $0.03 per share
» Reduced annual sustaining capital from $20 million to $10 million
19
100 150 200
$0 $30 $60 $90 $120 $150 $180 $210 2017 2018 2019 (Millions)
Free Cash Flow (1)
Adjusted EBITDA Interest Sustaining Capital Dividend $88M $106M $98M
Free cash flow generation after sustaining capital, interest payments and dividends
(1) Free cash flow is a non-GAAP measure calculated as Adjusted EBITDA less interest and dividends paid and sustaining capital. Refer to
Non-GAAP Measures for additional information on these inputs.
Delivering energy to the world, so people and communities thrive » Challenging what’s possible with solutions to increase customer netbacks and improve capital efficiency » State-of-the-art midstream processing facilities located in high impact resource plays » Growth supported by:
disproportionate rate relative to aggregate production
economics for pipeline connecting to midstream facilities
» Financial strength with cash of $17M and $267M available credit, subject to covenant restrictions » Trading below midstream and environmental industry peers offers investment opportunity
20
(1) As defined on Slide 2.
Kerrobert Terminal
22
The midstream and environmental solutions we provide our customers are designed not only to help reduce costs, but also lower emissions, increase safety, manage water, recycle by-products and protect the environment
23
24
Forward Looking Statements: This presentation contains "forward-looking statements" and/or "forward-looking information" within the meaning of applicable securities laws (collectively referred to as "forward-looking statements"). When used in this document, the words “may”, “would”, “could”, “will”, “intend”, “plan”, “anticipate”, “believe”, “estimate”, “expect”, and similar expressions, as they relate to SECURE, or its management, are intended to identify forward-looking statements. Forward-looking statements included or implied herein may include: management's expectations with respect to the business, financial prospects and future opportunities for the Corporation; general market conditions; the oil and natural gas industry; activity levels in the oil and gas sector in Canada and the U.S.; industry growth trends; the impact of near-term over supply issues on the crude oil market in 2020 and the impact on the Corporation’s business, operations and financial results; SECURE’s capital allocation priorities; the Corporation’s ability to meet obligations and commitments and operate within any credit facility restrictions, including the financial covenants related to our debt facilities; expectations that our capital investment, share repurchases and cash dividends will be funded from internally generated cash flows; the benefits of midstream infrastructure and production concentrated volumes on SECURE's cash flow and the expected stability of such sources of cash flow; the Corporation's growth and expansion strategy; the Corporation’s ability to continue to grow the business organically and execute on strategic growth opportunities based on current financial position; demand for the Corporation's services and products; market share and market expansion; opportunities for the Corporation’s storage assets; the timing of completion for projects underway, in particular the East Kaybob Oil Pipeline, and the timing and stability of contributions from this project; corporate growth opportunities and strategy, future business drivers; the impact the Canadian Federal Government’s orphan and inactive well fund may have to the business, operations and results of the Corporation; environmental and regulatory standards; the Corporation’s proposed 2020 and 2021 capital expenditure programs including growth and expansion and sustaining capital expenditures; the Corporation’s ability to execute our restructuring plans and align the Corporation’s cost structure with expected industry activity levels; and the expected impacts of the Corporation's cost and capital expenditure reductions. Forward-looking statements are based on certain assumptions that SECURE has made in respect thereof as at the date of this document regarding, among other things: the impact of COVID-19, including related government responses related thereto and lower global energy pricing on oil and gas industry exploration and development activity levels and production volumes (including as a result of demand and supply shifts caused by COVID-19 and the actions of OPEC and non-OPEC countries); the success of SECURE's
a timely manner; that there are no unforeseen events preventing the performance of contracts or the completion of the relevant facilities; that there are no unforeseen material costs relation to the Corporation's facilities; and that prevailing regulatory, tax and environmental laws and regulations apply. Forward-looking statements involve significant known and unknown risks and uncertainties, should not be read as guarantees of future performance or results, and will not necessarily be accurate indications of whether such results will be achieved. Readers are cautioned not to place undue reliance on these statements as a number of factors could cause actual results to differ materially from the results discussed in these forward-looking statements, including but not limited to those factors referred to under the heading "Risk Factors" in the 2019 Annual Information Form located on SEDAR. In addition, the effects and impacts of the COVID-19 outbreak, the rapid decline in global energy prices and the length of time to significantly reduce the global threat of COVID-19 on SECURE's business, the global economy and markets are unknown at this time and could cause SECURE's actual results to differ materially from the forward-looking statements contained in this document. Although forward-looking statements contained in this document are based upon what the Corporation believes are reasonable assumptions, the Corporation cannot assure investors that actual results will be consistent with these forward- looking statements. The forward-looking statements in this document are expressly qualified by this cautionary statement. Unless otherwise required by law, SECURE does not intend, or assume any obligation, to update these forward-looking statements. Non-GAAP Measures and Operational Definitions: The Corporation uses accounting principles that are generally accepted in Canada (the issuer’s “GAAP”), which includes International Financial Reporting Standards (“IFRS”). Certain supplementary measures in this document do not have any standardized meaning as prescribed by IFRS. These measures are intended as a complement to results provided in accordance with IFRS. The Corporation believes these measures provide additional useful information to analysts, shareholders and other users to understand the Corporation’s financial results, profitability, cost management, liquidity and ability to generate funds to finance its operations. However, they should not be used as an alternative to IFRS measures because they do not have a standardized meaning under IFRS and therefore may not be comparable to similar measures presented by other companies. These non-GAAP measures, and certain operational definitions used by the Corporation, are further explained in the Corporation’s most recent MD&A, which includes reconciliations of the Non-GAAP measures to the most directly comparable measures calculated in accordance with IFRS except as described below. Free cash flow is calculated as Adjusted EBITDA less interest paid, sustaining capital expenditures and dividend payments. Free cash flow is not a recognized measure under IFRS and therefore may not be comparable to similar measures presented by other
cash flow yield is Adjusted EBITDA less interest paid and sustaining capital expenditures as a percentage of market capitalization. Capital Expenditures: Expansion, growth or acquisition capital are capital expenditures with the intent to expand or restructure operations, enter into new locations or emerging markets, or complete a business acquisition. Sustaining capital refers to capital expenditures in respect of capital asset additions, replacements or improvements required to maintain ongoing business operations. The determination of what constitutes sustaining capital expenditures versus expansion capital involves judgment by management.