
SLIDE 1
1
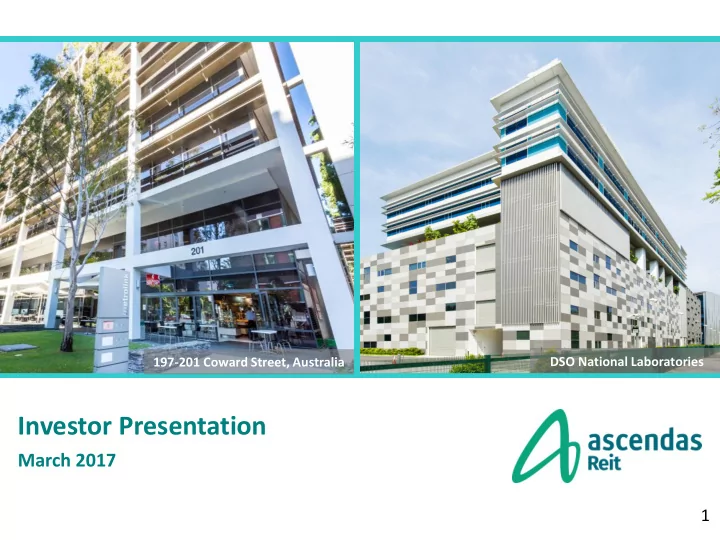
Investor Presentation
March 2017
DSO National Laboratories 197-201 Coward Street, Australia
Investor Presentation March 2017 1 Disclaimers This material shall - - PowerPoint PPT Presentation
DSO National Laboratories 197-201 Coward Street, Australia Investor Presentation March 2017 1 Disclaimers This material shall be read in conjunction with Ascendas Reits financial statements for the financial quarter ended 31 December 2016.
DSO National Laboratories 197-201 Coward Street, Australia
This material shall be read in conjunction with Ascendas Reit’s financial statements for the financial quarter ended 31 December 2016. This presentation may contain forward-looking statements that involve assumptions, risks and uncertainties. Actual future performance, outcomes and results may differ materially from those expressed in forward- looking statements as a result of a number of risks, uncertainties and assumptions. Representative examples of these factors include (without limitation) general industry and economic conditions, interest rate trends, cost
rental income and occupancy, changes in operating expenses, including employee wages, benefits and training, property expenses and governmental and public policy changes and the continued availability of financing in the amounts and the terms necessary to support Ascendas Reit's future business. Investors are cautioned not to place undue reliance on these forward-looking statements, which are based on the Manager’s current view
The value of units in Ascendas Reit (“Units”) and the income derived from them, if any, may fall as well as rise. Units are not obligations of, deposits in, or guaranteed by, the Manager or any of its affiliates. An investment in Units is subject to investment risks, including the possible loss of the principal amount invested. Investors should note that they will have no right to request the Manager to redeem or purchase their Units for so long as the Units are listed on the SGX-ST. It is intended that unitholders of Ascendas Reit may only deal in their Units through trading on the SGX-ST. Listing of the Units on the SGX-ST does not guarantee a liquid market for the Units. The past performance of Ascendas Reit is not necessarily indicative of the future performance of Ascendas Reit. Any discrepancies between the figures in the tables and charts and the listed amounts and totals thereof are due to rounding.
Logistics & Distribution Centres (S’pore & Australia)
constituent of the FTSE Straits Times Index effective 4 June 2014
Business & Science Park Light Industrial / Flatted Factories High Specs Industrial / Data Centres Integrated Development, Amenities & Retail (“IDAR”)
Diversified portfolio – 103 properties in Singapore and 28 properties in Australia*; Tenant base of around 1,390 local and international companies
* As at 28 February 2017. Excludes the forward purchase of a logistics property in Melbourne, Australia.
Sub-sector (as at 28 Feb 2017) Business Parks Science Parks
Portfolio GFA (sqm) 410,647 411,587 % of Ascendas Reit
11% 18% 11% 19% Characteristics Zone is defined by Govt Master Plan. Suburban office and corporate HQ buildings. Manufacturing activities are not allowed. Zone is defined by Govt Master Plan. R&D space equipped with building specifications to facilitate R&D works. Manufacturing activities are not allowed. Typical tenants Regional corporate HQs of industrial companies and MNCs; backroom support office of financial institutions; IT firms, etc. Companies in research & development in various fields including life sciences, food and chemicals, data analysis and IT research and development, etc.
Sub-sector (as at 28 Feb 2017) Integrated Development, Amenities & Retail (IDAR) Hi-Specs Industrial Data Centres
Portfolio GFA (sqm) 157,299 509,824* 109,756 % of Ascendas Reit
4% 7% 13% 14% 3% 6% Characteristics Two or more types of space within an integrated development such as business space, retail and warehousing facility. Typically larger scale developments. Possess infrastructure and amenities to meet business needs. Vertical corporate campus with higher office content combined with high specifications mixed-use industrial space. Building and M&E specifications (eg raised floor, high power capacity) to enable space to be used as data centres. Typical tenants MNCs and corporates that desire quality space with comprehensive range of amenities to house their HQ and conduct their businesses under one roof. Companies in IT, fast moving consumer goods, engineering, warehousing, retail. Multi-national industrial companies and large local companies that wish to co-locate their HQ functions with manufacturing services, engineering, R&D activities. Multi-national companies providing data centre services such as cloud computing and data storage.
*Excludes 50 Kallang Avenue which has been decommissioned for asset enhancement works
Sub-sector (as at 28 Feb 2017) Light Industrial Flatted Factories Logistics & Distribution Centres
Portfolio GFA (sqm) 393,740 197,143 835,825* % of Ascendas Reit
11% 7% 5% 3% 23% 13% Characteristics Low office content combined with manufacturing space. Stacked-up manufacturing space used for general manufacturing. Ground floor space tends to command higher rental rate due to higher floor loading and better accessibility. Warehouses with high floor loading and floor height. Well located near major transport nodes e.g. airport, seaport &
vehicular ramp access Typical tenants Large local companies which house their light manufacturing activities and HQ operations within a single facility. Higher manufacturing content compared to Hi-Specs Industrial buildings. Local small & medium-size enterprises engaged in various manufacturing activities. Some MNC manufacturers also house their manufacturing operations in such buildings. 3rd party logistics providers, manufacturers, distributors and trading companies *Excludes 279 Ahmad Ibrahim Road which has been decommissioned for asset enhancement works
proximity to MRT stations
Sub-sector
Logistics
Business Park
Properties 27 1 Portfolio GLA/NLA (sqm) 669,525 22,628 % of Ascendas Reit
value 18% 11% 1% 2% Characteristics Highly functional and modern properties; some include drive- through or drive around access. Well-located business space
CBD. Typical tenants 3rd party logistics providers, manufacturers, distributors and trading companies, end- users. Diverse range
park users – corporate
New South Wales Western Australia Queensland Victoria
Brisbane 155,966 sm
Logistics 7 properties
Sydney 259,336 sm
Logistics 10 properties Business Park 1 Property
Melbourne 255,956 sm
Logistics 9 properties
Perth 20,895 sm
Logistics 1 property
193,812
142,168
96,574(4)
3.946
(1) The Group had 130 properties as at 31 Dec 2016 and 31 Dec 2015. (2) Higher gross revenue mainly due to contributions from the acquisition of the Australian Portfolio and ONE@Changi City, partially offset by the divestment of Four Acres Singapore, Ascendas Z-Link and A-REIT City@Jinqiao. (3) Higher NPI mainly due to higher gross revenue coupled with lower utilities and property tax expenses. (4) Includes a provision of S$8.4 million performance fee (5) Includes taxable (3Q FY16/17: 3.717 cents, 3Q FY15/16: 3.810 cents), tax exempt (3Q FY16/17: 0.054 cents, 3Q FY15/16: 0.045 cents) and capital (3Q FY16/17: 0.222 cents, 3Q FY15/16: 0.091 cents) distributions.
(1) The Group had 130 properties and 131 properties as at 31 Dec and 30 Sep 2016, respectively. (2) Higher gross revenue and net property income mainly from the acquisition of 197 - 201 Coward Street, Mascot, Sydney on 9 Sep 2016, partially offset by the effects of the divestment of A-REIT City @Jinqiao on 17 Nov 2016. (3) Includes taxable (3Q FY16/17: 3.717 cents, 2Q FY16/17: 3.822 cents), tax exempt (3Q FY16/17: 0.054 cents, 2Q FY16/17: 0.096 cents) and capital (3Q FY16/17: 0.222 cents, 2Q FY16/17: 0.098 cents) distributions.
Country Purchase Consideration / Value (S$m) Completion date Proposed Acquisition 12, 14 and 16 Science Park Drive Singapore 420.0 16-Feb-17 Divestment A-REIT City @Jinqiao China 221.6 17-Nov-16 Completed Asset Enhancements (AEI) AkzoNobel House Singapore 6.5 4-Dec-16
Building / Address DSO National Laboratories DNV GL Technology Centre 12 Science Park Drive Singapore 118225 14 Science Park Drive Singapore 118226 16 Science Park Drive Singapore 118227 Purchase Consideration S$420.0 million Acquisition fee (to Manager) S$4.2 million Stamp duty and other transaction costs Approximately S$13.3 million (including stamp duty of ~S$12.6 million) Total Acquisition Cost S$437.5 million Vendor Ascendas Land (Singapore) Pte Ltd Valuation S$428.8 million by Edmund & Tie (formerly DTZ) ; S$430.0 million by Knight Frank Average = S$429.4 million TOP Date 23 Sep 2015 19 Jun 2013 19 Jun 2013 Land Area 39,436 sm Land Tenure 99 years leasehold from 1 Jun 1982; 64.4 years remaining (as at 31 Dec 2016) Contractual Gross Floor Area/ Net Lettable Area 69,016 sm 9,855 sm (Total: 78,871 sm) Occupancy 100% Weighted avg lease expiry 16.2 years Rental escalation 2.2% to 2.5% per annum
A-REIT City @Jinqiao Description Business park property located in the north section of the Jinqiao Economic and Technological Zone, in Shanghai, China Remaining Land Tenure 29 years NLA 81,994 sm Acquisition Year / Price 2013/ S$122.3m Book Value (as at 31 Mar 2016) S$204.0m Sales Price RMB 1,078m (S$221.6m)1 NPI Impact S$8.3m Buyer Wkland Investments II Limited Capital gains over
S$94.4m Completion Date 17 Nov 2016
1 Based on exchange rate of RMB1.00 = S$0.2056
In accordance to Ascendas Reit’s Trust Deed, the Manager is entitled to a divestment fee of 0.5% of the sale price of the Property.
Canopy at main lobby Description Cyclical replacement and capex works with respect to M&E services, lightings, intercoms. Aesthetic and reconfiguration works Remaining Land Tenure 44 years NLA 15,037 sm Acquisition Year / Price 2011/ S$80.0m Book Value (as at 31 Mar 2016) S$62.5m AEI Costs S$6.5m Completion Date 4 Dec 2016
Upgraded lift lobby
(1) Excludes fair value changes and amortised costs. Borrowings denominated in foreign currencies are translated at the prevailing exchange rates except for JPY/HKD-denominated debt issues, which are translated at the cross-currency swap rates that Ascendas Reit has committed to (2) Excludes the amount to be distributed for the relevant period after the reporting date
As at 31 Dec 16 As at 30 Sep 16 Total debt (S$m) (1) 3,089 3,370 Total assets (S$m) 9,702 9,851 Aggregate leverage 31.8% 34.2% Unitholders' funds (S$m) 5,935 5,768 Net asset value (NAV) per Unit 208 cents 205 cents Adjusted NAV per Unit (2) 204 cents 203 cents Units in issue (m) 2,851 2,816
8% 11% 31% 48% 2%
Diversified Financial Resources
238
200
200 446
95 100 192 350 154 357 62
200 300 400 500 600 700 800 2017 2018 2019 2020 2021 2022 2023 2024 2025 2026 and beyond SGD (million)
Debt Maturity Profile as at 31 Dec 2016
Revolving Credit Facilities Committed Revolving Credit Facilities Term Loan Facilities Medium Term Notes Exchangeable Collateralised Securities
As at 31 Dec 16 As at 30 Sept 16 Aggregate Leverage 31.8% (2) 34.2% Unencumbered properties as % of total investment properties(1) 77.3% 78.0% Interest cover ratio 5.6 x 5.3 x Debt / EBITDA 5.6 x 6.2 x Weighted average tenure of debt (years) 3.9 3.8 YTD weighted average all-in debt cost 3.0% 3.0%
(1) Total investment properties exclude properties reported as finance lease receivable (2) Based on total gross borrowings divided by total assets. Correspondingly, the ratio of total gross borrowings to total net assets is 52.0%
(1) Based on number of Units in issue of 2,851m as at 31 Dec 2016
Note: # Gross Floor Area as at 31 Dec 2016. * Gross Floor Area excludes 50 Kallang Avenue and 20 Tuas Avenue 1 (formerly known as IDS Logistics Corporate HQ/ 279 Jalan Ahmad Ibrahim) which have been decommissioned for AEI. ^ Gross Floor Area for Australia portfolio refers to the Gross Lettable Area/Net Lettable Area.
Gross Floor Area# (sm) 2,946,951* 692,153^ 3,639,104*
88.1% 97.5% 90.2% 87.9% 94.2% 89.1% 88.9% 94.4% 89.2% 0.0% 10.0% 20.0% 30.0% 40.0% 50.0% 60.0% 70.0% 80.0% 90.0% 100.0% Singapore Australia Total Dec-16 Sep-16 Dec-15
As at 31 Dec 2016 30 Sep 2016 31 Dec 2015 Total Singapore Portfolio GFA (sm) 2,946,951(1)(2)(3) 2,965,535 (2)(3) 2,372,023(4) Singapore Portfolio occupancy (same store) (5) 88.2% 88.3% 89.0% Singapore MTB occupancy (same store) (6) 84.5% 83.7% 84.5% Occupancy of Singapore investments completed in the last 12 months 85.4% 85.4%
88.1% 87.9% 88.9% Singapore MTB occupancy 84.0% 83.5% 84.5%
(1) Excludes 50 Kallang Avenue which has been decommissioned for asset enhancement works. (2) Excludes 20 Tuas Ave 1 (formerly IDS Logistics Corporate HQ / 279 Jalan Ahmad Ibrahim) which has been decommissioned for asset enhancement works. (3) Excludes Four Acres Singapore which was divested on 29 Apr 2016. (4) Excludes ONE@Changi City acquired in 1 March 2016 and 2 Senoko South which was decommissioned for asset enhancement works. Works were completed on 8 Apr 2016. (5) Same store portfolio occupancy rates for previous quarters are computed with the same list of properties as at 31 Dec 2016, excluding new investments completed in the last 12 months and divestments. (6) Same store MTB occupancy rates for previous quarters are computed with the same list of properties as at 31 Dec 2016, excluding new investments completed in the last 12 months, divestments and changes in classification of certain buildings from single-tenant to multi-tenant buildings or vice-versa.
As at 31 Dec 2016 30 Sep 2016 31 Dec 2015 Total Australian Portfolio GFA (sm) 692,153(1) 692,153(1) 630,947 Australian Portfolio occupancy (same store) (2) 97.2% 93.6% 94.4% Occupancy of Australian investments completed in the last quarter (3) 100.0% 100.0%
97.5% 94.2% 94.4%
(1) Includes 6 - 20 Clunies Ross Road (Sydney) and 197 – 201 Coward Street (Sydney) which were acquired on 22 February 2016 and 9 Sep 2016 respectively. (2) Same store occupancy rate excludes 6 - 20 Clunies Ross Road (Sydney) and 197-201 Coward Street (Sydney). (3) Investment property completed in the last quarter refers to 6 - 20 Clunies Ross Road (Sydney) and 197 – 201 Coward Street (Sydney).
0.5% 0.6% 4.1% 4.3% 4.7% 5.4% 8.3% 11.9% 13.9% 21.2% 25.2% 1.2% 1.7% 2.7% 3.6% 5.5% 8.0% 9.1% 13.8% 16.1% 17.2% 21.2%
Multi-tenant properties 3Q FY16/17 increase in renewal rates (1)# 2Q FY16/17 increase in renewal rates (2)# 3Q FY15/16 increase in renewal rates (3)#
Business & Science Parks 6.1% 2.8% 8.2% Hi-Specs Industrial 3.5%
4.8% Light Industrial 1.8% 0.3% 4.6% Logistics & Distribution Centres – Singapore 1.1%
6.1% Integrated Development, Amenities & Retail 0.0%
3.0% 0.9% 9.2% Logistics & Distribution Centres – Australia(4)
(1) Increase in renewal rental rates for leases renewed in 3Q FY16/17 versus previous contracted rates. (2) Increase in renewal rental rates for leases renewed in 2Q 16/17 versus previous contracted rates. (3) Increase in renewal rental rates for leases renewed in 3Q 15/16 versus previous contracted rates. (4) There were no renewals in Australia in 3Q FY16/17. # Based on average gross rents
24% 16% 13% 13% 7% 21% 6%
FY17/18
Breakdown of expiring leases for FY16/17 and FY17/18
FY16/17
3.7 years
total gross revenue
1.3% 1.8% 1.7% 2.1% 6.7% 1.1% 0.8% 1.7% 2.5% 0.6% 2.8% 0.5% 1.1% 4.7% 17.3% 15.2% 15.6% 5.7% 4.2% 4.0% 1.9% 2.5% 0.1% 0.3% 1.1% 0.6%
6.0% 19.1% 16.9% 17.8% 12.4% 5.3% 4.8% 3.6% 5.0% 0.7% 3.1% 0.2% 0.1% 1.6% 1.8% 1.7%
0% 5% 10% 15% 20% 25%
% of Ascendas Reit's Gross Revenue
Multi-tenant Buildings Single-tenant Buildings 12.1% 47.7% 5.7% 4.7% 15.5% 14.3%
FY16/17
Science Parks Business Parks Hi-Specs Industrial Light Industrial IDAR Logistics Logistics (Australia)
years
FY16/17
Breakdown of expiring leases for FY16/17 and FY17/18
12% 48% 6% 5% 16% 14%
FY16/17
Science Parks Business Parks Hi-Specs Industrial Light Industrial IDAR Logistics
25% 17% 14% 14% 8% 22%
FY17/18
1.4% 1.0% 0.8% 1.6% 6.5% 0.7% 1.0% 2.0% 2.1% 0.5% 1.2% 5.4% 19.2% 16.8% 16.7% 6.1% 3.8% 4.2% 2.8% 0.3% 1.3% 0.7%
6.8% 20.2% 17.6% 18.3% 12.6% 4.5% 5.2% 1.5% 4.8% 0.2% 2.4% 0.1% 1.8% 2.1% 1.9%
0% 5% 10% 15% 20% 25%
% of Ascendas Reit's Gross Revenue
Multi-tenant Buildings - SG Single-tenant Buildings - SG
Breakdown of expiring leases for FY17/18 and FY18/19
22% 18% 60%
FY17/18
Sydney Melbourne Brisbane Perth
25% 58% 17%
FY18/19
8.1% 8.3% 6.3% 8.0% 3.9% 15.0% 5.9% 3.6% 2.4% 2.8% 7.2% 2.2% 7.6% 5.1% 1.0% 1.0%
10.5% 11.1% 13.5% 10.2% 11.5% 1.9% 20.1% 6.9% 4.6% 8.4% 1.3%
0% 5% 10% 15% 20% 25%
% of Ascendas Reit's Gross Revenue
Multi-tenant building - AUS Single-tenant building - AUS
* formerly IDS Logistics Corporate HQ / 279 Jalan Ahmad Ibrahim
Artist impression of enhanced main lobby Artist impression of enhanced lobby Description Enhancement to main and lift lobbies, upgrading of lifts, replacement to energy efficient lighting, air-con systems, improvement to landscape and restrooms AEI Cost S$7.7 m Estimated Completion 3Q 2017 Land Tenure 46 years remaining GFA 49,851 sm #
# Total GFA for The Aries, Sparkle &
Business Park 18% Science Park 15% Hi-Specs Industrial 15% Data Centres 6% Light Industrial 7% Flatted Factories 3% Integrated Development, Amenities & Retail 8% Logistics & Distribution Centres Singapore 14% Logistics and Distribution Centres Australia 12% Business Park Australia 2%
Single-tenant buildings Multi-tenant buildings Notes:
facilities with vehicular ramp access.
92.1% 7.9%
Business & Science Park
69.3% 30.7%
Hi-Specs Industrial
70.3% 29.7%
Light Industrial
78.7% 21.3%
Integrated Development, Amenities & Retail
25.5% 74.5%
Logistics & Distribution
72.6% 27.4%
Logistics & Distribution
Australia, 14% Singapore , 86%
Note: Others include research & development, manufacturing, technical service and support industries for aerospace, oil and gas, multi-media products etc.
17.6% 0.5% 0.8% 0.9% 0.9% 1.1% 1.5% 1.6% 1.7% 1.7% 2.2% 2.6% 4.9% 7.1% 7.3% 7.7% 8.7% 9.9% 10.5% 10.8% 0% 5% 10% 15% 20% Others Rubber and Plastic Products Fabricated Metal Products Printing & Reproduction of Recorded Media Repair and Servicing of vehicles Chemical Textiles & Wearing Apparels Construction Medical, Precision & Optical Instruments, Clocks Hotels and restaurants Healthcare Products Food Products & Beverages Life Science Electronics Telecommunication & Datacentre Information Technology M&E and Machinery & Equipment Financial Distributors, trading company 3rd Party Logistics, Freight Forwarding
9.9% 90.1% Manufacturing area Non-manufacturing area
Tenants’ business activities by NLA As at 31 Dec 2016
4.9% 2.2% 2.1% 1.9% 1.6% 1.6% 1.2% 1.2% 1.2% 1.1%
Singapore Telecomm
Ltd DBS Bank Ltd Citibank, N.A Wesfarmers Group Ceva Logistics S Pte Ltd JPMorgan Chase Bank, N.A Biomedical Sciences Institutes (A*Star) Hydrochem (S) Pte Ltd Siemens Pte Ltd Credit Suisse AG
Aperia, 5.6% One@Changi City, 4.6% 1, 3, 5 Changi Business Park Crescent, 3.3% Kim Chuan Telecommunication Complex , 2.8% Neuros & Immunos, 2.6% TelePark, 2.4% 40 Penjuru Lane, 2.4% 31 International Business Park, 2.4% Hyflux Innovation Centre, 2.0% The Aries, Sparkle & Gemini, 2.0% TechPlace II, 1.9% TechPoint, 1.9% Nexus@One North, 1.8% Techview, 1.7% TechPlace I, 1.7% 10 Toh Guan Road, 1.6% The Kendall, 1.6% Pioneer Hub , 1.6% DBS Asia Hub (Phase I & II), 1.6% Techlink, 1.5% The Galen, 1.5% Corporation Place, 1.4% Nordic European Centre, 1.3% Siemens Centre, 1.2% FoodAxis @ Senoko, 1.2% HansaPoint @ CBP, 1.2% 138 Depot Road, 1.1% Infineon Building, 1.1% Senkee Logistics Hub (Phase I & II), 1.1% Giant Hypermart, 1.0% 7 Grevillia Street, 1.0% The Capricorn, 1.0% Changi Logistics Centre, 0.9% Acer Building, 0.9% Cintech IV, 0.9% The Alpha, 0.9% The Rutherford & Science Hub, 0.9% Courts Megastore, 0.9% Honeywell Building, 0.8% 6-20 Clunies Ross Street, 0.8% AkzoNobel House, 0.8% Others, 31.0%
* Based on number of Units in issue as at 31 Dec 2016 Note: Estimates for increase in MTB occupancy takes into account corresponding increases in variable costs. Estimates for a decline in MTB occupancy, assumes no reduction in variable costs to be conservative.
Total Returns
Proactive and dedicated manager with track record
Fund Manager: Ascendas Funds Management (S) Ltd Property Manager: Ascendas Services Pte Ltd Fund Manager: Ascendas Funds Management (S) Ltd
Performance Drivers Outcome Strategies
(For illustrative purpose)# FY15/16 FY16/17 Summary (S$ million) 1Q 2Q 3Q 4Q Total 1Q 2Q 3Q Gross Revenue 181 183 193 204 761 208 205 209 Net Property Income 124 124 142 144 534 149 152 155 Total amount available for distribution 92 94# 97 89 372# 107 113 115
2,408 2,408 2,504 2,666 2,666 2,674 2,816 2,851 Normalised Distribution Per Unit (cents) 3.841 3.889# 3.946 3.410 15.086# 3.882 4.016 3.993
# For illustrative purpose only, the “Total amount available for distribution” and the “Distribution Per Unit” includes proforma adjustments for (i) a one-off distribution of taxable income from operations of S$6.5m (DPU impact of 0.271 cents) for 2Q FY15/16 in relation to a rollover adjustment from prior years arising from a ruling by IRAS on the non-deductibility of certain upfront financing fees incurred in FY09/10 for certain credit facilities.
87.5% 87.4% 88.1% 87.4% 81.1% 89.5% 89.5% 89.1% 50% 55% 60% 65% 70% 75% 80% 85% 90% 95% 100% Business and Science Park Hi-Specs Industrial Light Industrial Logistics
A-REIT JTC
Occupancy Rate
Source : Ascendas Reit’s Singapore portfolio as at 31 Dec 2016. Market: JTC 3Q 2016 JTC statistics do not breakdown Hi-Specs Industrial and Light Industrial, ie they are treated as one category with occupancy of 89.5%
20 40 60 80 100 120
Industrial Rental Index Source : JTC
Source : CBRE for Business Park (City Fringe), Business Park (Rest of Island), Hi,Specs, Light Industrial and Logistics JTC for Business Parks (Median Rents)
$5.50 $4.25 $3.70 $3.10 $1.68 $1.65
0.5 1.5 2.5 3.5 4.5 5.5 6.5
Business Park (City Fringe) Business & Science Parks (Median Rents) Business Park (Rest of Island) Hi-Specs Light Industrial Logistics
FY16/17 are trending close to current market rates
Left Axis: Right Axis:
* Rates for ground floor space
* Excludes projects under 7,000 sm. Based on gross floor area Source: JTC, Ascendas Reit internal research
Sector ('000 sm) New Supply (Total) 2017 2018 2019 2020 Business & Science Park 19 10 9 % of Pre-committed (est) 100% 0% 100% 0% 100% Hi-Specifications Industrial 107 48 59 % of Pre-committed (est) 31% 0% 57% 0% 0% Light Industrial 1,708 888 355 385 80 % of Pre-committed (est) 38% 53% 23% 18% 36% Logistics & Distribution Centres 915 705 110 50 50 % of Pre-committed (est) 52% 46% 68% 57% 100% Total Pre-commitment 43%
Expected Completion Location Developer NLA (sm)* % Pre- committed (est) Completed 2016 Ayer Rajah (One-north) SHINE Systems Assets Pte Ltd 17,144 100% 2016 Science Park Ascendas Land (S) Pte Ltd. 40,500 80% 2016 Alexandra Terrace Mapletree Business City Pte Ltd 83,008 75% 2016 Vista Exchange Green BP – VISTA LLP 11,392 100% Under Construction 2018 Changi Business Park Central 2 Kingsmen Creatives Ltd 10,384 100% 2020 Pasir Panjang Road Singapore Science Park Ltd 9,288 100% Total 171,716 83%
Source: JTC & Ascendas Reit internal research
Important Notice
This presentation has been prepared by Ascendas Funds Management (S) Limited as Manager for Ascendas Real Estate Investment Trust. The details in this presentation provide general information only. It is not intended as investment or financial advice and must not be relied upon as such. You should obtain independent professional advice prior to making any decision. This presentation is not an offer or invitation for subscription or purchase of securities or other financial products. Past performance is no indication of future performance. All values are expressed in Singaporean currency unless otherwise stated.