
SLIDE 1
Investor Presentation
25th July, 2019
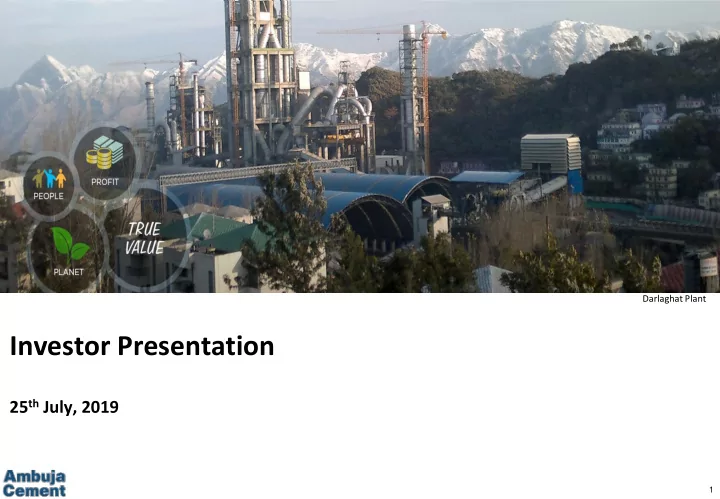
Darlaghat Plant
1
Investor Presentation 25 th July, 2019 1 Disclaimer / Safe Harbour - - PowerPoint PPT Presentation
Darlaghat Plant Investor Presentation 25 th July, 2019 1 Disclaimer / Safe Harbour Cautionary statement regarding forward-looking statements This presentation may contain certain forward-looking statements relating to Ambuja Cements Ltd. (
Darlaghat Plant
1
Cautionary statement regarding forward-looking statements This presentation may contain certain forward-looking statements relating to Ambuja Cements Ltd. (“Ambuja”, or “Company”) and its future business, development and economic performance. These statements include descriptions regarding the intent, belief or current expectations of the Company, its subsidiaries and associates and their respective directors and officers with respect to the results of operations and financial condition of the Company, subsidiary or associate, as the case may be. Such forward-looking statements are not guarantees of future performance and are subject to known and unknown risks, uncertainties and assumptions that are difficult to predict. These risks and uncertainties include, but are not limited to (1) competitive pressures; (2) legislative and regulatory developments; (3) global, macroeconomic and political trends; (4) fluctuations in currency exchange rates and general financial market conditions; (5) delay or inability in obtaining approvals from authorities; (6) technical developments; (7) litigation; (8) adverse publicity and news coverage, which could cause actual development and results to differ materially from the statements made in this presentation. Company assumes no obligation to update or alter forward-looking statements whether as a result of new information, future events or otherwise. Any forward-looking statements and projections made by third parties included in this presentation are not adopted by the Company and the Company is not responsible for such third party statements and projections. This presentation has been prepared by the Company based on information and data which the Company considers reliable, but the Company makes no representation or warranty, express or implied, whatsoever, and no reliance shall be placed on, the truth, accuracy, completeness, fairness and reasonableness of the contents of this presentation. This presentation may not be all inclusive and may not contain all of the information that you may consider material. Any liability in respect of the contents of, or any omission from, this presentation is expressly excluded. This presentation and its contents are confidential and should not be distributed, published or reproduced, in whole or in part, or disclosed by recipients directly or indirectly to any other person.
2
tonnes
(trade sales >80% of total volume).
62 bn
Current structure
Ambuja’s - Strategies in place to enhance value
Rajasthan will further strengthen our position in core markets of North and Gujarat.
margin management levers.
distance and savings in support process costs.
63.11% 50.05%
LafargeHolcim Ambuja Cement ACC
4.48%
Ambuja Cements Ltd. is one of the leading cement companies in India. It is part of the LafargeHolcim Group, the world leader in the building materials industry, with a presence in 80 countries, and a focus on cement, aggregate and concrete. For three decades, Ambuja Cements has provided hassle-free home building solutions with its unique sustainable development projects and environment-friendly practices.
3
4
5
507 622 1,129 463 698 1,162 Quarter 2 First Half Quarter 1
+76 +12% +33 +3% 2018 2019 EBITDA ₹ Cr. +235 +51%
6
6.37 5.82 Q2’18 Q2’19
Cement demand was muted in the quarter ended June’19, as the pace of construction activities slowed down due to liquidity issues in the market Mn Tonnes
12.59 12.19 H1’18 H1’19
7
2,927 2,912 Q2’18 Q2’19
– Growth of premium products – Sold more in high contribution markets
5,690 5,759 H1’18 H1’19 +1%
₹ Cr
8
622 698 Q2’18 Q2’19 +12%
– Higher realisations – Accelerated cost saving initiatives in key cost elements
1,129 1,162 H1’18 H1’19 +3%
₹ Cr
9
450 401 Q2’18 Q2’19
– Reduced consumption of purchased Limestone – Reduced gypsum and fly ash rates
442 395 H1’19 H1’18
₹ / t
10
consumption of Alternative Fuels contained the increase
1,023 1,037 Q2’19 Q2’18 +1% 1,021 1,075 H1’18 H1’19 +5%
₹ / t
11
1,370 1,261 Q2’18 Q2’19
– Network optimization – Re-negotiations of contracts – Change in mode mix
1,351 1,286 H1’18 H1’19
₹ / t
12
Other expenses flat on absolute basis, however higher on a per tonne basis on account of operating leverage
739 801 Q2’19 Q2’18 +8% 778 787 H1’18 H1’19 +1%
₹ / t
13
14
₹ Cr
Particulars Q2 2018 Q2 2019
∆ %
H1 2018 H1 2019
∆ %
Sales Volume MnT 6.37 5.82
12.59 12.19
NSP ₹ ton 4671 5030
7.7%
4617 4769
3.2%
Revenue from operation 3,017 2,978
5,880 5,906
0.4%
Other income* 191 58
242 298
23.1%
Total Income 3,208 3,036
6,122 6,204
1.3%
Total Expenses 2,395 2,280
4,750 4,744
Expenses ₹ ton 3,736 3,884 4.0% 3,758 3,870 3.0%
EBITDA 622 698
12.2%
1,129 1,162
2.9% EBITDA margin % 21.3% 24.0% 2.7 pp 19.8% 20.2% 0.4 pp EBITDA ₹ per tonne 970 1,190 22.6% 894 948 6.0%
Finance cost 19 20
5.3%
44 39
Depreciation and amortisation 136 131
276 262
Profit before Tax 658 605
1,051 1,159
10.3%
Tax expenses 159 193
21.4%
280 320
14.3%
Profit after Tax (PAT) 499 412
771 839
8.8%
EPS ₹ 2.51 2.08
3.88 4.23
9.0%
* Other income in Quarter 2, 2018 includes dividend received from ACC Ltd (our subsidiary) ₹ 141 Cr. In 2019, it was recognised in Quarter 1. Like for Like PAT is up by 15% (₹ 358 Cr to ₹ 412 Cr)
15
₹ Cr
Particulars Q2 2018 Q2 2019
∆ %
H1 2018 H1 2019
∆ %
Sales Volume – Cement (MnT) 13.61 13.02
26.94 26.89
Sales 6,683 6,925
3.6%
12,997 13,619
4.8%
EBITDA 1,294 1,484
14.7%
2,296 2,481
8.1% EBITDA margin (%) 19.4% 21.4% 2.0 pp 17.7% 18.2% 0.5 pp
Depreciation 286 278
574 558
Other Income 83 110
32.5%
168 373
122.0%
Finance Cost 47 41
91 79
Exceptional Item 44
2 4
92.5%
6 9
47.5%
Profit Before Tax 1,002 1,279
27.6%
1,761 2,226
26.4%
Tax Expenses 318 448
40.8%
563 699
24.1%
Profit Before minority 684 831
21.5%
1,198 1,527
27.5%
Non Controlling Interest 159 209
31.2%
283 409
44.4%
Profit After Tax 525 623
18.5%
915 1,118
22.2%
EPS ₹ 2.65 3.14
18.5%
4.61 5.63
22.2%
16
₹ Cr
17
18
19
C 2017 LafargeHolcim
O
To be launched
20
21
Buildcem Powercem 53 Railcem Powercem 43 Ambuja PPC Ambuja Roof Special PuraSand Ambuja Compocem Ambuja Cool Walls Ambuja Blockol
Ambuja Cement aspires to be the most competitive and sustainable company in the cement manufacturing industry. Acting in a sustainable manner is not only a business imperative but also provides the company with a competitive advantage
22