
SLIDE 1
INVESTOR PRESENTATION
February 2019
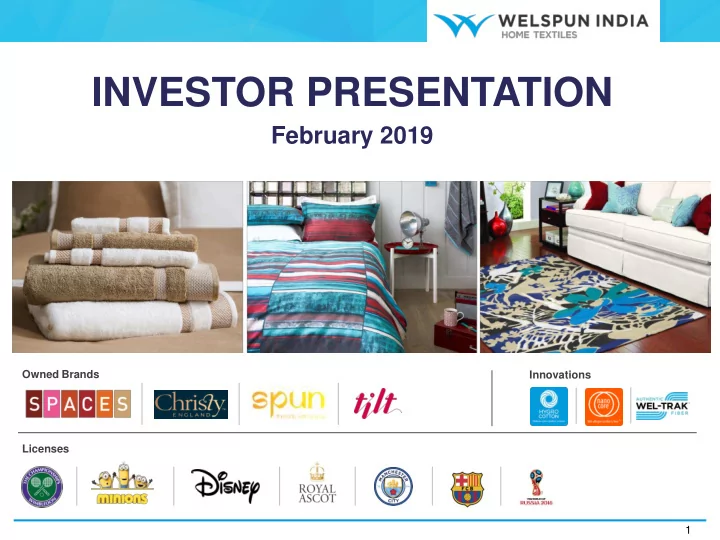
1 Owned Brands Licenses Innovations
INVESTOR PRESENTATION February 2019 Owned Brands Innovations - - PowerPoint PPT Presentation
INVESTOR PRESENTATION February 2019 Owned Brands Innovations Licenses 1 DISCLAIMER The information contained in this presentation is provided by Welspun India Limited (the Company), although care has been taken to ensure that the
1 Owned Brands Licenses Innovations
2
The information contained in this presentation is provided by Welspun India Limited (the “Company”), although care has been taken to ensure that the information in this presentation is accurate, and that the opinions expressed are fair and reasonable, the information is subject to change without notice, its accuracy, fairness or completeness is not guaranteed and has not been independently verified and no express or implied warranty is made thereto. You must make your own assessment of the relevance, accuracy and adequacy of the information contained in this presentation and must make such independent investigation as you may consider necessary or appropriate for such purpose. Neither the Company nor any of its directors assume any responsibility or liability for, the accuracy or completeness of, or any errors or omissions in, any information or opinions contained
howsoever arising from any use of this presentation or its contents or otherwise arising in connection therewith. The statements contained in this document speak only as at the date as of which they are made, and the Company expressly disclaims any obligation or undertaking to supplement, amend or disseminate any updates or revisions to any statements contained herein to reflect any change in events, conditions or circumstances on which any such statements are based. By preparing this presentation, none of the Company, its management, and their respective advisers undertakes any obligation to provide the recipient with access to any additional information or to update this presentation or any additional information or to correct any inaccuracies in any such information which may become apparent. This document is for informational purposes and does not constitute or form part of a prospectus, a statement in lieu of a prospectus, an offering circular, offering memorandum, an advertisement, and should not be construed as an offer to sell or issue or the solicitation of an offer or an offer document to buy or acquire or sell securities of the Company or any
as amended, or any applicable law in India or as an inducement to enter into investment activity. No part of this document should be considered as a recommendation that any investor should subscribe to or purchase securities of the Company or any of its subsidiaries or affiliates and should not form the basis of, or be relied on in connection with, any contract or commitment or investment decision whatsoever. This document is not financial, legal, tax, investment or other product advice. This presentation contains statements of future expectations and other forward-looking statements which involve risks and uncertainties. These statements include descriptions regarding the intent, belief or current expectations of the Company or its officers with respect to the consolidated results of operations and financial condition, and future events and plans of the Company. These statements can be recognized by the use of words such as “expects,” “plans,” “will,” “estimates,” or words of similar meaning. Such forward-looking statements are not guarantees of future performance and actual results, performances or events may differ from those in the forward-looking statements as a result of various factors and assumptions. You are cautioned not to place undue reliance on these forward looking statements, which are based on the current view of the management of the Company on future events. No assurance can be given that future events will occur, or that assumptions are correct. The Company does not assume any responsibility to amend, modify or revise any forward-looking statements, on the basis of any subsequent developments, information or events, or otherwise. Any reference herein to "the Company" shall mean Welspun India Limited, together with its consolidated subsidiaries.
3
Global Leader in Large Diameter Pipes Global Leader in Home Textiles Infrastructure Investments in Oil & Gas Employees 25,000+ Fixed Asset Base US$ 1.1 Billion Group Revenue US$ 2.3 Billion
4
5
6
Trusted and Preferred Suppliers to
Global Retail Giants
among Home Textile Suppliers to USA by Home & Textiles Today magazine
Home Textiles Company Globally(1) With presence in
sold in the US is made by Welspun(2) Presence in
Note: (1) Based on consolidated revenues from Home Textiles segment. (2) Based on OTEXA CY2017 data. (3) FY18 Figures
37% Sales: Innovative Products(3) 17% Sales: Branded Products(3)
Education, Environment & Health, Empowerment
7
2010 1995
Set up Vapi, Gujarat facility for Towels
1993
Embarked upon Capacity Expansion & Vertical Integration
2014
Began the journey in Textiles
1985
Acquired Christy – most prestigious brand of towels in the UK
2006
Launched: shopwelspun.com & .in Brand, SPUN globally ‘Hygro’ branding campaign in the US
2015
Commissioned India’s largest Spinning facility under one roof
2016
Entry into Rugs
2008 2017
Foray into:
Increasing footprint in Middle East, Japan, Australia, EU
2012
Ranked No.1 Home Textile exporter to the US
FY 2005
Set up Anjar, Gujarat facility Entry into bedsheets
2018
Established industry defining, patented traceability solution: Wel-Trak
Revenues (Rs. Bn)
CAGR 14% (2008-18) 61 53 32 16 4.5 1.3
2018 2015 2012 2008 2005 1995 1985
Began Operations
FY
68.5% 8.0% 10.1% 0.7% 12.8% 68.5% 7.0% 10.0% 0.6% 13.9%
Shareholding Pattern Market Statistics
As on Dec 31, 2018 INR USD Price per share 59.80 0.86 No of Shares outstanding (Mn) 1,005 1,005 Market Capitalization (Mn) 60,099 862 Daily Average Trading Volumes (Q3FY19) No of shares in Mn 1.01 1.01 Daily Average Trading Value (Q3FY19) (Mn) 61 0.88
Dec 31, 2018 Sept 30, 2018
Promoter FIIs Mutual Funds Banks and Insurance Cos Public
8
Source: BSE & NSE
9
10
Source: WTO - 2016 data, Texprocil, OTEXA
India 5% China 35% India 6% China 37% India 11% China 35%
Strong Presence of India Next Opportunity for India
11
Global Home Textile Market
(USD Bn)
US and Europe are the major end markets comprising a third each of the home textile market Indian Players have concentrated in US because: US is a large and homogenous market making it a more attractive market to target first While US is a level playing field, Europe provides preferential tariff rates to some competing countries
45 67 2015 2020E Wholesale Level 136 203 Retail Level
Market Composition
Europe 33% US 33% Row 33%
Source: OTEXA, Industry Reports
US Home Textile Market (2016)
(USD Bn)
COTTON PILLOWCASES, $0.4 COTTON SHEETS, $1.5 COTTON TOWELS, $1.6 COTTON BEDSPREADS , $0.9 MMF FLOOR COVERINGS, $3.0 OTHER COTTON PRODUCTS, $3.0 OTHER NON- COTTON PRODUCTS, $5.0
US Home Textile Market valued at c.$15 bn
30% 38% 40% 39% 39%
23% 25% 23% 24% 25% 22% 22% 22% 21% 20%
24% 15% 15% 16% 16%
CY2009 CY2015 CY2016 CY2017 YTD CY2018 India China Pakistan ROW
27% 48% 49% 50% 50%
29% 23% 21% 20% 21% 26% 16% 15% 15% 16%
18% 13% 14% 14% 13%
CY2009 CY2015 CY2016 CY2017 YTD CY2018 India China Pakistan ROW
India continues to dominate the US Towel Market
12
Market Share in US Towel Market Market Share in US Sheet Market
Half of the US Sheet Market is served by India
Source: OTEXA, October 2018 Update
9 percentage pts 23 percentage pts
13
Largest Producer of Cotton Strong Political Leadership with Supportive Policies Strong Domestic Market Potential Global Manufacturing Scale Favourable Socio-Economic Factors Competitive Costs
14
Diversified Brand Portfolio
15
Leading Market Player with a Wide Product Range
1
Global Distribution Network with Marquee Clients
4
Sustainability at the Core
6
Experienced Board and Management with Proven Track Record
7
Consistent focus on free cash flow
8
Vertically Integrated Presence with Significant Capabilities
2 3
Track Record of Innovation
5
16
LEADING MARKET PLAYER WITH A WIDE PRODUCT RANGE 1
Widest product range in the Home Textiles segment Towels, Bath Robe Sheets, TOB, Basic & Fashion Bedding Carpets, Rugs, Flooring Solutions A differentiated End-to-end Solutions Provider in Home Textiles Uniquely positioned for cross-selling due to Customer reach, Competitive manufacturing, Global delivery model Higher wallet share due to multi-product portfolio Strong track record of customer satisfaction and repeat business from them; 80% revenue from replenishment
16% 21% CY13 CY17 41% 50% CY13 CY17
LEADING MARKET PLAYER
17
1
Welspun’s Market Share in US Towels Market
Source: OTEXA
Welspun’s Share in India’s exports to US - Towels Welspun’s Share in India’s exports to US - Sheets
Ranked No.1 supplier to the US 5 times in last 6 years by Home & Textiles Today magazine Every 5th towel sold in US is made by Welspun Every 10th sheet sold in US is made by Welspun
15% 19% CY13 CY17 7% 10% CY13 CY17
Welspun’s Market Share in US Sheets Market
18
Growing Capabilities
FY18 Effective Utilisation: Towels : 80% Sheets : 80% Rugs : 65% Investment of around Rs. 9 bn planned in FY19; Rs. 5.6 bn done in 9MFY19 Majority of the investment towards flooring solutions project Cotton Spinning Weaving Processing Cutting & Sewing Logistics India Supply Advantage Vertically Integrated Facilities Across Manufacturing Chain Current integration of about 70% in Spinning and Weaving Captive power generation Welspun India’s backward integration has helped improve margin, better quality control and timely delivery
45 50 60 72 80
FY14 FY15 FY16 FY17 FY18
Towels (‘000 MT)
55 60 72 90 90
FY14 FY15 FY16 FY17 FY18
Bed Linens (‘Mn mtrs)
6 8 8 10 10
FY14 FY15 FY16 FY17 FY18
Rugs & Carpets (‘Mn sq. mtrs)
2
Captive Power
GLOBAL DISTRIBUTION NETWORK WITH MARQUEE CLIENTS
19
3 Delivery and Reach in Over 50 Countries
Country Served Corp HQ/Marketing Offices Manufacturing Facility Warehouses
DIVERSIFIED BRAND PORTFOLIO
20
4 Spectrum of Welspun Brands: Continue to Evolve
Premium & Luxury Innovation Sustainability & Empowerment Technology
Coveted Licenses
Branded Products Contribution to Sales at 17% in FY18
TRACK RECORD OF INNOVATION
21
5
for bedding products in US post stringent testing
Top Universities Technology Partners Industry Associations
30% 34% 36% 37% FY15 FY16 FY17 FY18
Increasing Share of Innovative Products
The Innovative & Branded products account for more than 45%
HYGRO Cotton
Regulates temperature for individual comfort before washing after 3 washings
22
SUSTAINABILITY: FOCUS ON THE 3Es 6
Medical Vans
sports
sanitary pads
3Es of Corporate Social Value
Education Empowerment Environment & Health Empowerment
through distributorship model in villages ensuring each woman and adolescent has access to sanitary pads. So far 60 entrepreneurs are created impacting over 22,000 women in the villages of Anjar, Vapi, Saharanpur and Dewas
various discipline of sports coming from struggling backgrounds
Education
software in govt school classrooms impacting over 50,000 children of Valsad, Kutch and Bharuch districts in Gujarat
with 75 Teachers
school catering to 200 students from 1st to 9th std
Environment & Health
Anjar
anemia in women. Operational in 10 villages of Anjar and 5 villages of Vapi benefitting over 22,000 villagers
23
Welspun Smart Village
Environment
Empowerment
Education
Essential Infrastructure
kerbstones
disposal systems
E-Connectivity
INCLUSIVE GROWTH: IMPLEMENTING SMART VILLAGES 6
SA 8000 Certified Operations for Socially Responsible Practices STP Installed with a Capacity to Process 30 MN Liters Per Day; currently saving 6,500 million Liters of Narmada River Water annually 10,000+ Youth Trained via Welspun’s Skill Development Program 1,200+ Women Engaged Across 10 Vocational Centers Annual saving of 9 mn kWh of Energy
24
85% Water Recovered From STP Used at Plant
SUSTAINABILITY IN EVERYTHING THAT WE DO 6
7
25
B.K.Goenka, Chairman
Arun Todarwal, Independent Director, Audit Committee Chairman
Women in Indian Business’ by Business Today for 3 consecutive years
Pradeep Poddar, Independent Director
products industry and vast experience in brand building
Arvind Singhal, Independent Director
management & operations consulting firm with focus on Textiles, Retail, Healthcare etc
Shalil Mukund Awale, Nominee Director
sector, Retail Banking, Investment & Treasury, Venture Capital Finance, Audit
Board of Directors
Rajesh Mandawewala, Managing Director
brands – SPACES and Welhome
Altaf Jiwani, CFO (Welspun India)
merchandising, sourcing and licencing in the retail industry .
Ritesh Khandelwal, CEO (Christy)
vendor management, merchandise planning, product development, retailing
Mukesh Savlani, CEO (Welspun Flooring)
Management Team
AWARDS & ACCOLADES – TESTIMONY TO EXCELLENCE
26 Asia’s 50 Power Businesswoman Dipali Goenka Featured at #16 in Asia’s Top 50 Power Businesswomen (2016)
and many more….
STP Water Recycle & Reuse Platinum Award Water Stewardship (2018) Marketing Marketing Services Award “Spaces” (2018)
7
Top-3 in Product-Wise Sustainability scores (2017) Sustainability Highest Exports Winner of 1 Platinum, 2 Gold & 1 Silver Trophies (2018) Social Media Digital / Social Media Campaign of the Year Christy (2018)
FCF positive for four consecutive years
27
795 3,770 859 907 714 2,405 785 786 FY15 FY16 FY17 FY18
FCF Dividend
8
Net Profit & Cash Profit FY17 figures adjusted for exceptional item CAGR is based on FY13-FY18 28
Total Income CAGR 11% EBITDA CAGR 13% Net Profit CAGR 11% Cash Profit CAGR 18%
8 TREND OF FINANCIAL PERFORMANCE
36,965 44,772 54,924 60,143 67,211 61,318 50,109 FY13 FY14 FY15 FY16 FY17 FY18 9MFY19
6,438 10,253 13,691 16,831 16,639 12,046 8,943 FY13 FY14 FY15 FY16 FY17 FY18 9MFY19
2,248 4,195 5,398 7,365 6,979 3,850 2,891 FY13 FY14 FY15 FY16 FY17 FY18 9MFY19
4,178 6,237 9,017 12,074 13,779 9,413 6,804 FY13 FY14 FY15 FY16 FY17 FY18 9MFY19
29
Welspun’s patented Wel-Trak™ process, supplemented by scientific traceability from Oritain™, is now the industry defining end-to-end fiber tracking process.
30
31
Assured Supply Lower transportation costs Lower inventory Lower Interest cost Recycling of packaging
SYNERGISTIC BENEFITS
32
33
34
Innovation Brands New Markets
Women Employees
Share of Domestic Revenue
Revenue
Innovative / Branded Revenue Share
Net Debt
New Channels New Products
1 2 3 4 5
35
1
Creating interactive experiences through seamless integration of smart technology with home textiles Patented augmented reality home décor
36
2
Reinvigorated the Christy Brand, which has dominant presence in UK Introduced the brand in US, China and Middle East; witnessed healthy growth Coveted Associations like Wimbledon, Rugby World Cup and Royal Ascot
Christy Brand Reinvigorated & Launched Globally
2008 2013 2017
37
2
India – one of the fastest growing economies in the world with huge potential for increasing organized market ‘Spaces’ was recently recognized as a best brand in home category by Myntra. Also, received Amazon Marketing Services Award for Spaces Presence in 200+ shop-in-shops Licenses for Domestic Market:
Focus on tapping Domestic Market potential
Redesigned Brand Strategy
Use of 360 degree marketing approach by increasing customer touch points including social media, POS, in-store, PR news, TV,
Revisited Spaces brand campaign
38
3
United States: 66-68% Europe: 17-18% India: 6-7% RoW: 9-10%
Presence in Japan, the Middle East, Australia, Russia and South Africa Presence in Europe is limited because:
Bangladesh have preferential tariff rates from EU, exempting them from import duties
more recent, mainly through its innovative products Continue to gain market share in the US Home Textile market and grow its US business in the medium – long term
presence in subscale / new markets
for larger share of incremental revenue going forward
Future Strategy
Composition of Sales (FY18)
is expected to grow from INR 257bn in 2016 to INR 438bn by 2021 (i.e. CAGR of 11.25%)
for all by 2022’ to boost domestic consumption
accelerate move towards
39
4
In key developed markets, E-commerce constitutes 10-15% in Home Textiles. Expected to reach ~25% by FY23
Welspun approach to tap the Ecommerce opportunity
Own Website Big-Box Retailers’ Websites Key Ecommerce Platforms Exclusive Online D2C Players
Christy in UK is own website/exclusive online
presence across key markets
portal
existing big-box retailers
channels of these retailers
retailers on Product Development, Warehousing, Pick and Pack, Drop-Ship and Analytics
Germany and India
increasing share of private labels to capture more value, cater to increased volumes and to have better control
sourcing partner for these key ecommerce platforms’ private labels
penetrating D2C channels
minority stake in select ventures as a strategic investor
brands and tap D2C channels
Welspun sees Omni-channel as an opportunity
40
4
Welspun only constitutes ~3% of total US hospitality market Opportunity
High potential global wellness economy of about $3.7 trillion
impact that travel has on the human body
Strategy Focus on domestic as well as international markets Tied up with leading hotel chains and wellness centers
41
5
Welspun Flooring: Fully integrated and independent flooring vertical
Wide range of Flooring products Carpet Tiles Broadloom Carpets & Area Rugs Artificial Grass
42
5
Untapped Opportunity in Bedding
1
Smart Textiles
3
Technical / Advanced Textiles
2
aerospace, defense, automobile, railways and other utilities.
stain resistant, anti-bacterial, PET resistant, and soil resistance, among
Volatile raw material costs Rising energy costs Volatile Rupee Differentiation Strategy : Innovation, Branding & Sustainability Industry Defining Traceability Solution Focus on Domestic Market New Product Lines New channels
43
44
For further details, please contact:
Harish Venkateswaran AVP - Group Finance and Strategy Email: harish_venkateswaran@welspun.com Altaf Jiwani Director (Finance) & CFO - Welspun India Limited Email: altaf_jiwani@welspun.com
45
46
Double-digit revenue growth continues, predominantly volume-driven Wel-Trak products contribute 3% to overall revenues Successful exhibition of Welspun’s flooring range at AceTech exhibitions across India as well as Domotex, Germany Launched Copper and Charcoal infused products as part of innovation portfolio Major business expansion in the Hospitality business in India as well as abroad Advanced textile division approved as a supplier by
players in wet-wipes
(Rs. Million)
Exceptional expense is on account of the legal expenses related to the class action suit on the provenance issue * Cash Profit = PBDT (before exceptionals) less Current Tax ** EPS not annualised 47
Particulars Q3FY19 Q3FY18 Change YoY Q2FY19 Change QoQ Total income 16,574 14,143 17.2% 17,978
Adjusted EBITDA 2,890 2,685 7.7% 3,105
Adjusted EBITDA Margin 17.4% 19.0%
17.3% 17 bps Forex Gain in Other Income 2 82 Forex (loss) in Other Expenses (385) (0)
2,506 2,687
3,186
EBITDA Margin 15.1% 19.0%
17.7%
Finance Cost 402 345 16.4% 369 8.9% Depreciation 1,118 1,272
1,083 3.2% PBT (before exceptional) 986 1,070
1,734
Exceptional (Loss) (294)
PAT (After Minority Interest) 471 774
1,148
PAT Margin 2.8% 5.5%
6.4%
Cash Profit* 1,928 2,270
2,435
EPS** (Rs.) 0.47 0.77
1.14
(Rs. Million)
48
Exceptional expense is on account of the legal expenses related to the class action suit on the provenance issue * Cash Profit = PBDT (before exceptionals) less Current Tax ** EPS not annualised
Particulars 9MFY19 9MFY18 Change YoY Total income 50,109 45,969 9.0% Adjusted EBITDA 9,107 8,970 1.5% Adjusted EBITDA Margin 18.2% 19.5%
Forex Gain in Other Income
Forex (loss) in Other Expenses (164) (0) EBITDA 8,943 9,124
EBITDA Margin 17.8% 19.8%
Finance Cost 1,114 1,027 8.5% Depreciation 3,259 3,741
PBT (before exceptional) 4,570 4,356 4.9% Exceptional (Loss) (407)
2,891 2,983
PAT Margin 5.8% 6.5%
Cash Profit* 6,804 7,088
EPS** (Rs.) 2.88 2.97
(Rs. Million)
49
* Cash Profit = PBDT (before exceptionals) less Current Tax ** Adjusted for stock split
Particulars FY15 FY16 FY17 FY18 9MFY19 Total income 54,924 60,143 67,211 61,318 50,109 Growth % 22.7% 9.5% 11.8%
9.0% EBITDA 13,691 16,831 16,639 12,046 8,943 EBITDA Margin 24.9% 28.0% 24.8% 19.6% 17.8% Depreciation 3,329 3,718 5,054 5,042 3,259 Finance cost 2,829 2,368 1,583 1,408 1,114 PBT (before exceptional) 7,533 10,745 10,003 5,597 4,570 Exceptional (Loss)
PBT 7,533 10,745 5,355 5,597 4,163 PAT (After Minority Interest) 5,398 7,365 3,576 3,850 2,891 Cash Profit* 9,095 12,074 13,779 9,413 6,804 EPS** (Rs.) 5.4 7.3 3.6 3.8 2.9
(Rs. Million)
# Capital Employed = Net worth + Gross Debt + Other Long Term Liabilities * Net Current Assets does not include Cash & Cash Equivalents 50
Particulars 31-Mar-15 31-Mar-16 31-Mar-17 31-Mar-18 31-Dec-18 Net Worth 14,732 19,700 23,971 26,057 28,213 Short Term Loans 13,936 13,533 11,721 12,580 15,763 Long Term Loans 20,864 18,945 21,393 20,228 19,980 Welspun Flooring debt
Gross Debt 34,800 32,478 33,114 32,807 35,743 Cash & Cash Equiv. 4,321 1,388 2,725 2,538 4,352 Net Debt 30,479 31,090 30,389 30,269 31,392 Net Debt excluding Flooring debt 30,479 31,090 30,389 30,269 29,356 Average Capital Employed # 47,619 53,331 58,189 62,111 65,337 Net Fixed Assets (incl CWIP) 26,049 33,508 35,713 33,641 33,137 Net Current Assets* 17,630 16,845 20,114 23,734 24,219 Total Assets 58,960 65,491 73,283 72,249 77,489
Continuous Improvement in Net Debt/Equity
51
FY15 FY16 FY17 FY18 9MFY19 Net debt/Equity 2.07 1.58 1.27 1.16 1.11 Net debt/EBITDA 2.23 1.85 1.83 2.51 2.63 EBIT/Interest 3.66 5.54 7.32 4.98 5.10 Current Ratio 1.12 1.15 1.41 1.42 1.28 Fixed Asset turnover 2.04 1.77 1.86 1.80 2.00 Total Asset turnover 0.90 0.90 0.91 0.84 0.86 Inventory days 76 68 70 79 68 Debtor days 40 52 53 56 55 Payable days 30 41 41 39 36 Cash conversion cycle 86 79 82 96 87 ROE 41.8% 42.8% 29.6% 15.4% 14.2% ROCE (pre-tax) 21.8% 24.6% 19.3% 11.3% 11.6%
Return ratios Solvency ratios Operational ratios
52
Period Standalone EPS DPS Dividend tax per share Payout Percentage FY15 5.09 1.05 0.21 25% FY16 5.99 1.30 0.26 26% FY17 3.05 0.65 0.13 26% FY18 3.03 0.65 0.13 26%