
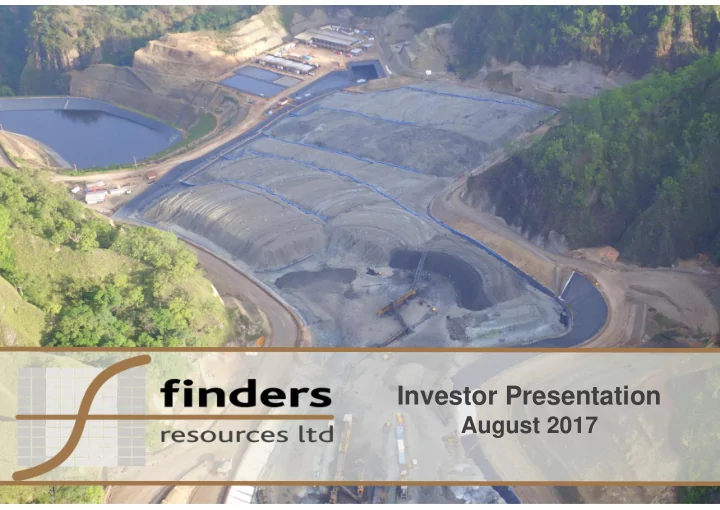
SLIDE 1
Investor Presentation
August 2017
Investor Presentation August 2017 Disclaimer This presentation - - PowerPoint PPT Presentation
Investor Presentation August 2017 Disclaimer This presentation (Presentation) has been prepared by Finders Resources Limited (Finders) based on information available to it and from third party sources. By retaining this Presentation, you (the
August 2017
2
This presentation (Presentation) has been prepared by Finders Resources Limited (Finders) based on information available to it and from third party sources. By retaining this Presentation, you (the Recipient) acknowledge and represent to Finders that you have read, understood and accepted the terms of this Important Notice. If you do not accept these terms, you should immediately destroy or delete this Presentation. This Presentation does not purport to contain all the information that a prospective investor may require in connection with any potential investment in Finders. You should not treat the contents of this Presentation, or any information provided in connection with it, as financial advice, financial product advice or advice relating to legal, taxation or investment matters. No representation or warranty is made by Finders or any of its advisers, agents or employees as to the accuracy, completeness or reasonableness of the information contained in this Presentation or provided in connection with it. No information contained in this Presentation or any other written or oral communication in connection with it is, or shall be relied upon as, a promise or representation and no representation or warranty is made as to the accuracy or attainability of any estimates, forecasts or projections set out in this Presentation. No liability will attach to Finders with respect to any such information, estimates, forecasts or projections. Finders does not accept responsibility or liability for any loss or damage suffered or incurred by you or any other person or entity however caused (including, without limitation, negligence) relating in any way to this Presentation including, without limitation, the information contained in or provided in connection with it, any errors or omissions from it however caused (including without limitation, where caused by third parties), lack of accuracy, completeness, currency or reliability, or you or any other person or entity placing any reliance on this Presentation, its accuracy, completeness, currency or reliability. Finders does not accept any responsibility to inform you of any matter arising or coming to Finders’ notice after the date of this Presentation which may affect any matter referred to in this Presentation. Any liability of Finders, their advisers, agents and employees to you or to any other person or entity arising out of this Presentation including pursuant to the Australian Securities and Investments Commission Act 2001, Corporations Act 2001, Part IVA or V (including sections 51AA, 51AB, 51AC, 52 or 53) of the Trade Practices Act 1974 or any corresponding provision of any state or territory legislation, or similar provision under any applicable law is, to the maximum extent permitted by law, expressly disclaimed and excluded. The distribution of this Presentation may be restricted by law in certain jurisdictions. Recipients and any other persons who come into possession of this Presentation must inform themselves about, and observe any such restrictions. Future matters: This Presentation contains reference to certain intentions, expectations, future plans, strategy and prospects of Finders. Those intentions, expectations, future plans, strategy and prospects may or may not be achieved. They are based on certain assumptions, which may not be met or on which views may differ and may be affected by known and unknown risks. The performance and operations of Finders may be influenced by a number of factors, many of which are outside the control of Finders. No representation or warranty, express or implied, is made by Finders, or any of its directors, officers, employees, advisers or agents that any intentions, expectations or plans will be achieved either totally or partially or that any particular rate of return will be achieved Given the risks and uncertainties that may cause Finders’ actual future results, performance or achievements to be materially different from those expected, planned or intended, Recipients should not place undue reliance on these intentions, expectations, future plans, strategy and prospects. Finders does not warrant or represent that the actual results, performance or achievements will be as expected, planned or intended. Exploration Targets: References to Exploration Targets or Targets in this document are in accordance with guidelines of the JORC Code (2012). As such it is important to note that the reported targets are based on existing data, historical production and geology models. Any references to grade and quantity are conceptual in nature. Exploration carried out to date is insufficient to be able to estimate and report mineral resources in accordance with the JORC Code (2012). It is uncertain if further exploration will result in the determination of a Mineral Resource.
3
Provident Minerals 13.7% Taurus Resources 11.3% Resource Capital Fund 9.5% Saratoga 8.5%
1. Includes 12m shares issued as part of mandatory converting notes (commercially ordinary shares) but excludes 11.1m shares issued to employees at prices from 19c to 30c per share subject to vesting conditions which are not dilutive at current prices 2. Exercise prices: 31m at 25.6c 3. Finders Indonesian subsidiary, PT Batutua Tembaga Raya
58% 40% 2%
REGISTER
Institutions Public Management
BOARD
Gary Comb Independent Chairman Barry Cahill Managing Director Gordon Galt Non-executive Director (Taurus rep) Gavin Caudle Non-executive Director (Provident rep)
CAPITAL STRUCTURE
Ordinary shares 774 million1 Options (Unlisted, Out of the Money) 31 million2 Share Price (31 July 2017) A$0.20 Market Capitalisation ̴A$155 million Finders Cash US$3 million
PROJECT FINANCIALS (BTR
3)
Finders 74.1% Debt Facility (30 June 2017) ̴US$71.5 million VAT Facility (7 July 2017) ̴US$2.1 million Cash (30 June 2017) ̴US$3.3 million Hedge (30 June 2017) ̴US$(15.5) million
plant operational and generating revenue
plant producing at nameplate
with total debt facility paid down to US$73.6 million
years
US$1.05/lb
identified to grow mine life
4
March 2017 quarter
2,253 tonnes with value of US$13.1 million at 31 March 2017
5
December 2016 quarter
2,880 tonnes with value of US$16.7 million at 31 December 2016 June 2017 quarter
1,729 tonnes with value of US$10.3 million at 30 June 2017
Note: unaudited results
6
Wetar Copper Project
Batu Hijau Grasberg Tembang Martabe Way Linggo Gosowong North Lanut Pongkor Toka Tindung Cibaliung Jakarta Operating gold mine Operating copper mine Tujuh Bukit Denpasar
7
commissioned in March 2014
in May 2016.
Kuning to maintain solution inventory
8 500 1,000 1,500 2,000 2,500
Copper cathode tonnes
3kt plant 25kt plant 28,000 t.p.a. copper cathode
9
$0 $10 $20 $30 $40 $50 $60 $70 $80 $90 $100 US$2.10 US$2.30 US$2.50 US$2.70 US$m Cu price USD/lb
Project EBITDA
Sensitivity Analysis (post debt facility and hedge)
$0 $10 $20 $30 $40 $50 $60 $70 $80 $90 $100 US$2.10 US$2.30 US$2.50 US$2.70 US$m Cu price USD/lb
Operating Cash
$0 $10 $20 $30 $40 $50 $60 $70 $80 $90 $100 US$2.10 US$2.30 US$2.50 US$2.70 US$m Cu price USD/lb
NPAT
10
0% 20% 40% 60% 80% 100%
Project IRR
100 200 300 400
Project post tax NPV10 (US$m)
100 200 300 400 500 600
LOM Cash Surplus (US$m)
production from both plants
US$6,000 per tonne
Sensitivity Analysis (post debt facility)
11
2.3% Cu, current strip ratio <1:1
pound
12
SFR AVB FND MLX OZL AIS TGS CDU HGO 0.0% 0.5% 1.0% 1.5% 2.0% 2.5% 3.0% 3.5% 4.0%
1,000,000 1,500,000 2,000,000 2,500,000
Reserve grade (% Cu) Reserve size (t Cu)
Reserve grade and size bubble chart1
Data is based on published company information as at 24 February 2017 1. Excludes metal by-product credits
13
$- $500.00 $1,000.00 $1,500.00 $2,000.00 $2,500.00 $3,000.00 AVB SFR FND OZL TGS HGO AIS
A$/t
EV/copper reserve tonne1
0.00 0.50 1.00 1.50 2.00
C1 cost (US$/lb)
2016 C1 cash cost (US$/lb Cu)
$- $5,000.00 $10,000.00 $15,000.00 $20,000.00 $25,000.00 AVB OZL SFR FND TGS AIS HGO
$A/t
EV/annual copper production tonne1,2
Data is based on published company information as at 24 February 2017 1. Excludes metal by-product credits 2. Annual production based on company guidance for CY2017 otherwise CY2016
14
leach pads
exploration
massive sulphide repetitions around planned Lerokis mine site and immediate environs completed
increase Lerokis resource
program for infrastructure, sterilization and the addition of near mine resources
barite/Au/Ag mineralization overlaying and adjacent to known massive sulphides
15
16
leach pads
sulphide body with variable copper enrichment
volcanic rocks - open to north & west
at 1.14% Cu, 0.49g/t Au & 15g/t Ag
definition drilling planned (42 holes for ~4,600m)
17
interpretation and historic drilling
18
~A$155 million
/management team and supportive institutional shareholder base
nameplate capacity of 28,000 t.p.a. copper cathode
copper prices with short payback
life through incremental resource expansion and regional exploration
19
20
21
leach – clean ore and good percolation
generates heat and acid
controls temperature
parameters proven
solvent extraction (SX)
produce copper cathode
22
Wetar Copper Project – Ore Reserve Estimate as at 30th June 2016
Proved Probable Total Mt Cu% Mt Cu% Mt Cu% Cu (Kt) Kali Kuning Open Pit (COG 0.4% Cu) Primary 3.6 2.7 0.5 2.7 4.1 2.7 111 Transition 0.8 1.2 0.3 1.3 1.1 1.2 13 Leached 0.1 0.5 0.01 0.8 0.1 0.6 1 Total 4.6 2.4 0.7 2.2 5.3 2.4 126 Waste 3.9 Strip Ratio 0.7 Lerokis Open Pit (COG 0.5% Cu) Primary 2.1 2.3 0.4 2.0 2.5 2.3 59 Total 2.1 2.3 0.4 2.0 2.5 2.3 59 Waste 1.9 Strip Ratio 0.8 Total Kali Kuning and Lerokis Open Pits COG as above 6.7 2.4 1.2 2.2 7.8 2.3 184 Heap Leach Pads (ex-mine minus cathode production and decommissioned leach pads) Kali Kuning 0.8 2.4
2.4 18 Total 0.8 2.4
2.4 18 Total Ore Reserve (including Heap Leach Pads) COGs as above 7.4 2.4 1.2 2.2 8.6 2.3 202
Notes – The Ore Reserve Estimate for the open pit mines is derived from the Mineral Resource block models for the Kali Kuning and Lerokis deposits. The tonnes and grades are stated to a number of significant digits reflecting the confidence of the estimate. Since each number and total is rounded individually the columns and rows in the above table may not show exact sums or weighted averages of the reported tonnes and grades. “Stripping Ratio” refers to the ratio of the waste to the ore tonnage.
23
Mineral Resource Estimate The information in this report that relates to mineral resource estimation for the Kali Kuning and Lerokis deposits is based on prior work completed by external consultants that has been reviewed by Mr Terry Burns who is a Fellow and Chartered Professional of the Australasian Institute of Mining and Metallurgy (#107527). Mr Burns has sufficient experience which is relevant to the style of mineralisation and type of deposit under consideration and to the activity which he is undertaking to qualify as a Competent Person as defined in the 2012 Edition of the ‘Australasian Code for Reporting of Exploration Results, Mineral Resources and Ore Reserves’. Mr Burns is contracted by Banda Minerals Pty Ltd, a 100% owned subsidiary of Finders Resources Limited, and consents to the inclusion in the reports of the matters based on his information in the form and context in which it appears. Ore Reserve Estimate The information in this report that relates to the in-situ ore reserve estimation at the Kali Kuning and Lerokis deposits is based on ongoing and prior work completed by external consultants and PT Batutua Tembaga Raya employees that has been reviewed by Mr Nick Holthouse who is a full-time employee of PT Batutua Tembaga Raya (a subsidiary of Finders Resources Limited) and who is a Member of the Australasian Institute of Mining and Metallurgy (#305303). The information in this report that relates to the ore reserve estimation for the heap leach pads is based on ongoing and prior work completed by external consultants and PT Batutua Tembaga Raya employees that has been reviewed by Mr Augy Wilangkara who is a full time employee of PT Batutua Tembaga Raya (a subsidiary of Finders Resources Limited) and who is a Member of the Australasian Institute of Mining and Metallurgy (#206768) Both Mr Holthouse and Mr Wilangkara have sufficient experience which is relevant to the style of mineralisation, the type of deposit and the beneficiation method under consideration and to the activity which they are undertaking to qualify as Competent Persons as defined in the 2012 Edition of the ‘Australasian Code for Reporting of Exploration Results, Mineral Resources and Ore Reserves’. Both Mr Holthouse and Mr Wilangkara consent to the inclusion in the report of the matters based on their reviewed information in the form and context in which it appears. Exploration Results The information in this report that relates to Exploration Results and Targets is based on information compiled by Mr Terry Burns who is a Fellow and Chartered Professional of the Australasian Institute of Mining and Metallurgy (#107527). Mr Burns has sufficient experience which is relevant to the style of mineralisation and type
Reporting of Exploration Results, Mineral Resources and Ore Reserves’. Mr Burns is an exploration consultant contracted by Banda Minerals Pty Ltd, a 100% owned subsidiary of Finders Resources Limited, and consents to the inclusion in the reports of the matters based on his information in the form and context in which it appears.
Syndicate of banks
Corporation
Senior loan facilities
facility
an average price of US$4,800 from July 2017 to March 2019
Project level equity
funding from Daewoo
subsidiary company which has a 95% economic interest in Wetar
cathode production
80% production 24
Indonesian subsidiary, PT Batutua Tembaga Raya (“BTR”), in partnership with Daewoo. BTR in turn has an economic interest of 95% in the Wetar copper project
permit (“IUP”) valid to 2031
processing and refining valid to 2031
forestry use permit (“Pinjam Pakai”) which allows the company to carry
production activities until 2031
under granted exploration IUPs
25
26
~400,000 oz Au and 12,500,000 oz Ag previously recovered
sulphides
sulphides
stockworks
isolated massive sulphide bodies adjacent to KKV infrastructure
barite/Au/Ag intercepts with anomalous copper and deeper TEM anomaly
metal anomaly with no drilling
metal anomaly with limited drilling
barite/Au/Ag accumulations in the Lerokis area
Barry Cahill Phil Retter
Managing Director Investor & Media Relations +61 (0)8 6555 3992 +61 (0) 407 440 882 bjc@findersresources.com phil@nwrcommunications.com.au
27