investor presentation
play

Investor presentation 27 October 2011 Cameron Clyne, Group Chief - PDF document

Investor presentation 27 October 2011 Cameron Clyne, Group Chief Executive Officer Mark Joiner, Executive Director Finance National Australia Bank Limited ABN 12 004 044 937 Good result and progress against strategy FY11 2H11 Change Change


  1. Investor presentation 27 October 2011 Cameron Clyne, Group Chief Executive Officer Mark Joiner, Executive Director Finance National Australia Bank Limited ABN 12 004 044 937 Good result and progress against strategy FY11 2H11 Change Change on Sep 10 on Mar 11 Revenue ($m) 17,594 5.7% 0.0% Cash earnings ($m) 5,460 19.2% 4.6% Tier 1 ratio 9.70% 79bps 51bps Dividend 172 20 4 (100% franked cps) 15.2% 200bps 10bps Cash ROE (%) Statutory net profit 5,219 23.6% 15.0% attributable to owners ($m) 2

  2. United Kingdom Economic outlook � GDP growth expected to rise to 2% in 2012 Australia � Sluggish economic recovery � � Recovery post floods Credit demand affected by weak housing market and de-leveraging � Multi-speed economy household and business sectors � Expect through the year � Credit growth expected to remain soft GDP growth of approx 3.2% 77% as income growth remains modest at December 2011 and 3.1% � Sterling depreciation is assisting at December 2012* exports and trade flows � Strong demand for Australian 13% � Interest rates at all time lows bulk commodity exports � Large mining investment New Zealand projects � Recovery under way � Unemployment low by global standards. Other measures � Housing market still soft but improving of the labour market showing � High commodity prices helping exporters positive signs � Main risk to the NZ economy lies in what 9% happens to global conditions China � Robust domestic activity United States and foreign trade 1% � Continuing slow recovery � Easing inflation � Risk of recession receding � Expect soft landing ~ 8.25% GDP growth in 2012 � Soft labour market data, with weak job creation and a persistently high unemployment rate % represent share of 30 September 2011 GLAs, Australia includes Asia 3 * Through the year growth is the GDP for the December quarter compared with the prior year December quarter Strong progress against strategic priorities Progress to date 2012 areas of focus � Strengthened capital ratios � Preparation for Basel III � Increased liquidity � Secured funding Balance sheet � Improved funding position strength � Infrastructure and network � Re-platforming and infrastructure Efficiency, transformation underway and network transformation quality and � Re-platforming programme progressing � Continued discipline in efficiency and process improvements � Customer processes improved service � Improved customer satisfaction � Maintain customer satisfaction � Strengthened employee engagement � Continue to differentiate from peers People, culture and collaboration � Leverage reputational gains and reputation � Stronger reputation and brand � Personal Banking more competitive � Maximise value from positions offshore � Wholesale Banking refocused on the Portfolio core franchise � Continue to de-risk and run-off SGA � SGA run-off progressing well � Cross-sell 4

  3. Transforming the way we do business � Improved customer experience and service delivery � Ageing infrastructure replaced End state � Operational risk reduced � More competitive cost structure Infrastructure Re-platforming Customer Key & Network Programme Process programmes Transformation (NextGen) Transformation � Activated customer � Mortgage transformation � Network modernisation analytics functionality significantly progressed completed – 100% of � New Australian general � Service improvements in sites upgraded Significant 3 rd Party broker channel ledger operational � Contact centre voice infrastructure pilot sites � Securitisation platform – � Customer facing systems achievements implemented additional capability availability increased � Workplace service uplift deployed commenced – PC refresh � Foundation release of � Contact centre voice � New private client Core Banking deployed infrastructure completed platform launched � New credit risk engine � Continue to progress � Mortgage and funds transfer FY12 priorities payments systems transformation complete pricing capability replacement � Extend UBank capabilities � Customer relationship � Continue to upgrade management and ‘single technology infrastructure customer view’ capability 5 2012 outlook � Macro outlook uncertain and ongoing volatility likely � Well placed to navigate the uncertainty � Firmly focused on execution against strategic priorities � Manage to positive jaws 6

  4. 2H11 Financials Group financial result Sep 11 Change on Sep 11 Change on $m Full year Sep 10 Half year Mar 11 Net interest income 13,092 6.5% 6,788 7.7% Other operating income (incl MLC) 4,502 3.5% 2,007 (19.6% ) Net operating income 17,594 5.7% 8,795 0.0% Operating expenses (7,974) (1.4% ) (3,983) 0.2% Underlying profit 9,620 9.6% 4,812 0.1% B&DDs (1,822) 19.5% (834) 15.6% Cash earnings 5,460 19.2% 2,792 4.6% Cash ROE (% ) 15.2% 200bps 15.2% 10bps NIM (% ) 2.25% 0bps 2.28% 5bps Core Tier 1 ratio (% ) 7.58% 78bps 7.58% 46bps 8

  5. Net interest margin Group net interest margin Business unit net interest margin – half on half attribution analysis Half year to (% ) Sep 11 Mar 11 Sep 10 (0.01%) 0.03% 0.04% (0.01%) Business Banking 2.66 2.57 2.50 Personal Banking 2.17 2.22 2.28 2.28% 2.23% UK Banking 2.33 2.33 2.28 Mar 11 Lending Lending Mix Markets & Liquid & Sep 11 NZ Banking 2.35 2.24 2.24 Margin Treasury Short-term As sets Anticipate NIM pressures due to: � Rising wholesale funding costs � Heightened competition for assets � Ongoing competition for deposits � Regulatory changes (e.g. level and composition of liquids) 9 Jaws and investment spend Jaws and banking CTI momentum CTI 1H11 CTI 2H11 CTI 1H10 CTI 2H10 43.9% 43.5% 45.5% 46.2% 4.7% Expense 3.6% growth 1.3% -1.6% +4.9% 0.0% 2.0% -3.1% +0.2% -0.2% -0.2% Revenue -1.8% growth 1H11 v 2H10 2H11 v 1H11 2H10 v 1H10 1H10 v 2H09 CTI – Banki ng cost to i ncome r atio Jaws momentum (ex SCDO and FX) Investment spend ($m) 814 955 1,160 5.0% 6% 4% 3% Expense 4.2% growth 31% 48% 62% 2.3% +3.3% -2.9% 49% 37% +1.7% Revenue 25% 1.7% growth 1.3% 14% 11% 10% 0.6% Sep 09 Sep 10 Sep 11 2H10 v 1H10 1H11 v 2H10 2H11 v 1H11 Compliance Infrastructure Efficiency and Revenue Other 10

  6. Business Banking and Personal Banking 
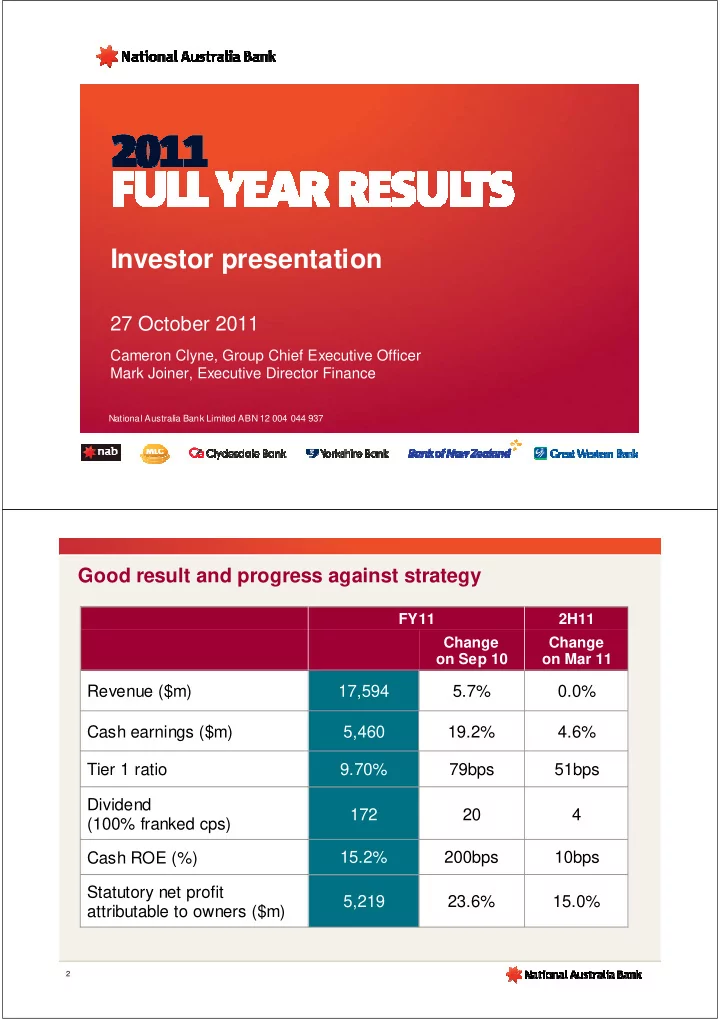
Business Banking net interest margin Business lending market share 1 (%) (%) 2.66 22.8 2.57 22.1 22.2 2.51 21.5 2.50 Mar 10 Sep 10 Mar 11 Sep 11 Mar 10 Sep 10 Mar 11 Aug 11 Personal Banking home loan multiple Personal Banking MFI customer satisfaction 2 of system growth 1 (%) 78.5 (x) 0.3% 3.4 78.2 3.2 2.7 74.1 1.1 -5.1% 0.8 69.0 Mar 09 Sep 09 Mar 10 Sep 10 Mar 11 Sep 11 Sep 09 Mar 10 Sep 10 Mar 11 Aug 11 Weighted aver age of thr ee major bank peers NAB (1) RBA Financial System/NAB 11 (2) Roy Morgan Research, Aust MFIs, popula tion aged 14+, six month mov ing av erage. Customer satisfaction is based on customers who ans wered v ery/fairly satisfied. NAB compared with the weighted av erage of the three maj or banks (ANZ, CBA, WBC) Wholesale Banking and MLC & NAB Wealth Wholesale Banking - infrastructure Project Finance Wholesale Banking revenue by line of business and natural resources ($m) 1,033 997 895 859 404 426 174 375 GMR Energy New Roy al Plenary Living Singapore Adelaide AUD745m 685 Hospital 629 571 SGD975m 520 Proj ect Finance AUD2,605m Facilityt Proj ect Finance Proj ect Finance Facility Manda ted Lead Facility Mar 10 Sep 10 Mar 11 Sep 11 Manda ted Lead Arranger, Underwriter, Manda ted Lead Arranger Insurance Customer Risk Arranger Bank Role Bookrunner July 2011 June 2011 July 2011 • Customer compr ises Sales, Asset Servicing, Specialised F inance and Financial Institutions Group • Risk comprises FICC (1) and Treasury MLC & NAB Wealth - movement in FUM MLC & NAB Wealth adviser movement ($bn) (#) 312 (175) Retail Retail Retail 72% 71% 70% 0.5 (8.8) 5.8 0.0 178 (119) 113 (0.5) (0.4) 211 (142) 1,864 121.9 1,727 116.1 112.7 1,555 1,486 ������ ��������� ������� ��� ����� ������ ��������� ���������� ����� ������ Mar 10 Re cruits Exits Sep 10 Recru its Exits Meritum Mar 11 Recru its Exits Sep 11 �������� �������� (1) Fixed Income, Currencies & Commodities, formerl y known as Global Markets T rading 12

Download Presentation
Download Policy: The content available on the website is offered to you 'AS IS' for your personal information and use only. It cannot be commercialized, licensed, or distributed on other websites without prior consent from the author. To download a presentation, simply click this link. If you encounter any difficulties during the download process, it's possible that the publisher has removed the file from their server.

Recommend


More recommend