
SLIDE 1
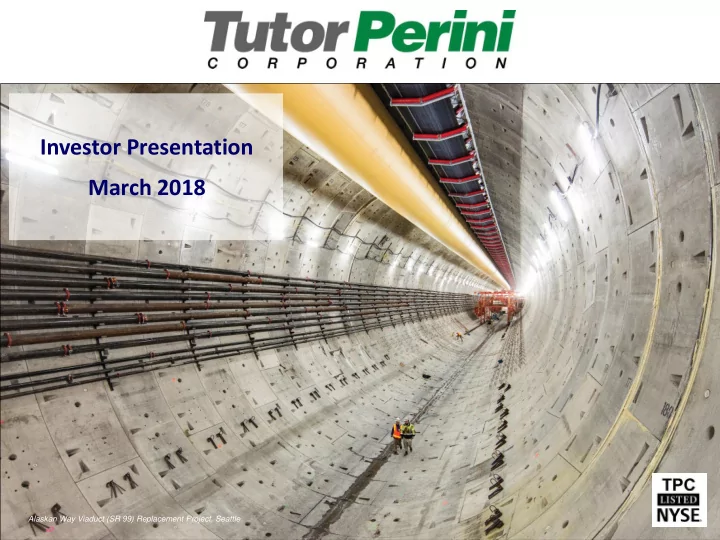
Investor Presentation March 2018
Alaskan Way Viaduct (SR 99) Replacement Project, Seattle
Investor Presentation March 2018 Alaskan Way Viaduct (SR 99) - - PowerPoint PPT Presentation
Investor Presentation March 2018 Alaskan Way Viaduct (SR 99) Replacement Project, Seattle Forward-Looking Statements Statements contained in this presentation that are not purely historical are forward-looking statements within the meaning of
Alaskan Way Viaduct (SR 99) Replacement Project, Seattle
Statements contained in this presentation that are not purely historical are forward-looking statements within the meaning of the Private Securities Litigation Reform Act of 1995, including without limitation, statements regarding the Company’s expectations, hopes, beliefs, intentions or strategies regarding the future and statements regarding future guidance or estimates and non- historical performance. These forward-looking statements are based on the Company’s current expectations and beliefs concerning future developments and their potential effects on the Company. While the Company’s expectations, beliefs and projections are expressed in good faith and the Company believes there is a reasonable basis for them, there can be no assurance that future developments affecting the Company will be those that we have anticipated. These forward-looking statements involve a number
2
3
* Includes multiple subsidiaries The Cosmopolitan Resort and Casino, Las Vegas
4
(approximate award values)
5
California High-Speed Rail Project, Central California Alaskan Way Viaduct (SR 99) Replacement, Seattle Pechanga Resort and Casino Expansion, Temecula, CA Central Subway T-Line Extension, San Francisco
A Leading Construction Services Firm
Revenue: $4.8B Income from Construction Ops. (ICO): $179.5M(1) (3.8% Op. Margin) Net Income Attributable to TPC: $148.4M(2) Operating Cash Flow: $163.6M (record high) Q4-17 Backlog: $7.3B
Building Segment
Revenue: $1.9B ICO: $34.2M(3)
Q4-17 Backlog: $1.7B
Civil Segment
Revenue: $1.6B ICO: $192.2M(3)
Q4-17 Backlog: $4.1B Commonly uses guaranteed maximum price and cost plus fee contracts Specializes in:
Commonly uses fixed price and unit price contracts Specializes in:
Facilities
Specialty Contractors Segment
Revenue: $1.2B ICO: $18.9M(3)
Q4-17 Backlog: $1.5B Commonly uses fixed price, unit price and cost plus fee contracts Specializes in:
6
(1) Includes the impact of corporate general and administrative expenses of $65.9M; excludes other income of $43.9M. (2) Includes a tax benefit of $53.3M primarily related to the remeasurement of deferred tax assets and liabilities due to the Tax Cuts and Jobs Act of 2017. (3) Segment ICO amounts do not sum to total ICO amount due to corporate general and administrative expenses and rounding.
Other 11% Mass Transit 62% Bridges 15% Transportation 12%
Construction and rehabilitation of highways, bridges, tunnels, mass-transit systems and wastewater treatment facilities TPC’s highest margin segment (12.0% operating margin in 2017) Focused on large-scale, complex projects ($100M to $1B+) One of few leaders in the industry positioned to capture the largest projects
— Faces fewer competitors, as smaller contractors lack the technical experience, capability and bonding capacity to support large projects — Strong self-performance capabilities — Centralized, experienced cost estimating capabilities and sizeable equipment fleet
Very strong bidding activity and bid pipeline over the next several years Significant infrastructure spending boost expected due to recent voter- approved funding measures (e.g., $120B L.A. County Measure M; $54B Seattle Sound Transit 3), $52B 10-year California transportation bill and President Trump’s $1.5T infrastructure plan Experience and past performance on projects Financial strength key to obtaining bonding and pre-bid qualification Only major U.S. or international contractor with an office in Guam (presence for 40 years)
— Prepared for multi-billion-dollar troop relocation project opportunities CA High-Speed Rail, CA
7
East Side Access Project, NY
(1) Includes the Company’s tunnel projects
(1)
Office 1% Industrial 15% Gov't 20% Health Care 22% Hospitality and Gaming 13% Mixed Use 10% Condos 8% Education 6% Other 5%
Large and active bid pipeline over at least the next two years — Significant volume of prospective awards for projects in California, the Southwest and Northeast U.S. given strengths of Rudolph and Sletten and Tutor Perini Building Corp. Strong customer relationships and end market expertise Integrated business model with significant self-perform capabilities Established track record on numerous large government contracts
Leading Builder in California Large Corporate Customer Base Private / Non-Residential and Public Projects Expertise in Hospitality and Gaming, Design-Build and Accelerated Delivery Southeastern U.S. Focus Private / Non-Residential and Public Projects Construction and design-build services worldwide for U.S. military and government agencies and surety companies
CityCenter Las Vegas
8
The Cosmopolitan Resort & Casino, Las Vegas
Condos 8% Mass Transit 53% Industrial 7% Transportation 4% Mixed Use 9% Other 2% Education 7% Health Care 5% Water 5%
Strong demand, especially in New York City Strong electrical and mechanical proficiencies Performing substantial work for the Civil and Building groups — Positions TPC as a full-service contractor with greater control over scheduled work, project delivery and risk management Continuing to serve existing external customers Focused on New York City, Texas, California and Florida 9
East Side Access Queens Tunnels, NY World Trade Center, NY
One of the largest electrical contractors in New York City Electrical contractor with offices in Houston, Miami, New Orleans and Los Angeles Mechanical contractor with offices in New York City and Miami Mechanical contractor with offices in Los Angeles and Las Vegas Expertise in Pneumatic Concrete Placement Offices in Los Angeles and New York City
capabilities proving to be a competitive advantage
Greater control over schedule Greater visibility into price
10
Total project volume: $2.3B+
Project value: $2.7B
Project value: $840M
Hudson Yards Development, New York Central Subway T-Line Extension, San Francisco
11
12
Civil 57% ($4.1B) Building 23% ($1.7B) Specialty Contractors 20% ($1.5B) Private 26%
($1.9B)
Federal Government 8%
($553M)
State and Local Government 66%
($4.8B)
$4,176 $4,492 $4,920 $4,973 $4,757 $0 $1,000 $2,000 $3,000 $4,000 $5,000 $6,000 2013 2014 2015 2016 2017 Revenue $244 $287 $184 $276 $269 5.8% 6.4% 3.8% 5.6% 5.7% 2.0% 3.0% 4.0% 5.0% 6.0% 7.0% $0 $25 $50 $75 $100 $125 $150 $175 $200 $225 $250 $275 $300 $325 2013 2014 2015 2016 2017 EBITDA Margin EBITDA EBITDA EBITDA Margin
(a)
($ in millions)
13
(a) EBITDA and adjusted EBITDA (for 2015) are non-GAAP financial measures; see reconciliation to net income attributable to Tutor Perini Corp. in appendix. Net income attributable to Tutor Perini Corp. for 2013-2017 was $87.3M, $107.9M, $45.3M, $95.8M and $148.4M, respectively. (b) Represents adjusted EBITDA for 2015, which excludes a Civil segment litigation charge of $23.9M.
($ in millions)
(b)
**
14
15
East Side Access Project, New York
17
(1) Net income for 2017 includes a tax benefit of $53.3M primarily related to the remeasurement of deferred tax assets and liabilities due to the Tax Cuts and Jobs Act of 2017. (2) Includes amortization of discounts and debt issuance costs. Historical amortization and interest expense have been restated to reflect the adoption of Accounting Standards
Update 2015-03.
(3) Legal charge in Q3 2015 related to legacy litigation for a Frontier-Kemper (FK) joint venture, for which FK had a 20% non-sponsorship interest. Tutor Perini acquired FK in
2011, after the joint venture project was complete and already in litigation.