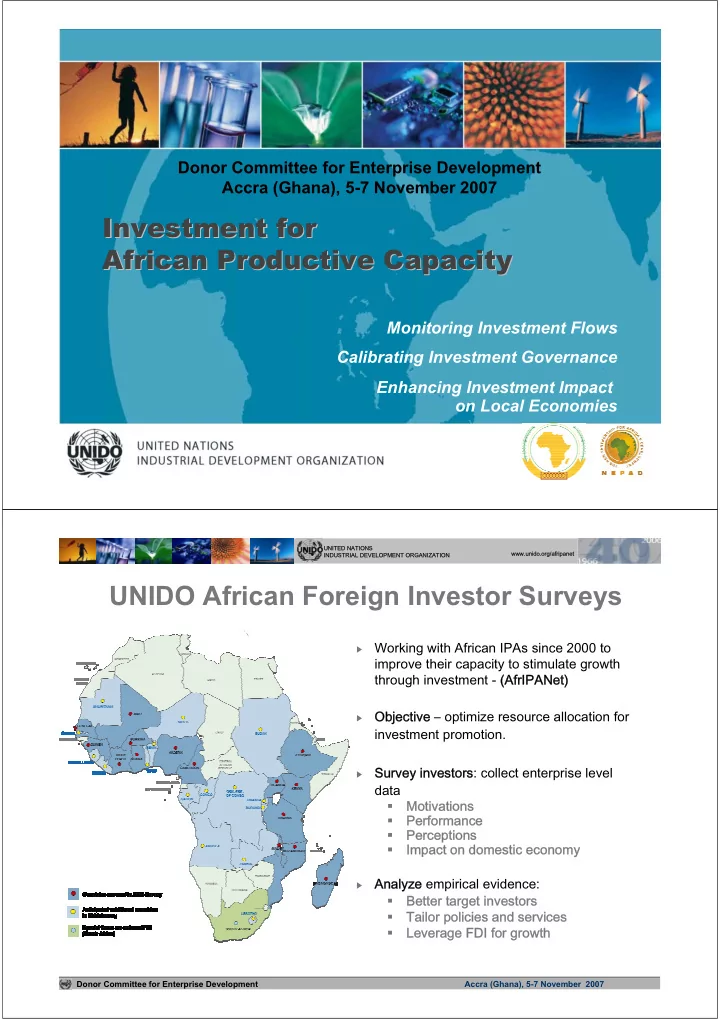

����������������������� � ��������� � ��������������������������������� ��������������������� � ������������������������������������������� ����� � ����������� � ����������� ����������� ����������� � �������������������������� � ��������������������������� � ����������������������� � ���������������������������� � � �������������������� � ����������������������� ������������������������������������������� ������������������������� �������������� � �������������� ����������������������������������� �������������� ����������������������������������� ����������������������� Donor Committee for Enterprise Development Accra (Ghana), 5-7 November 2007 Investment for Investment for African Productive Capacity African Productive Capacity Monitoring Investment Flows Calibrating Investment Governance Enhancing Investment Impact on Local Economies Donor Committee for Enterprise Development Accra (Ghana), 5-7 November 2007 UNIDO African Foreign Investor Surveys Donor Committee for Enterprise Development Accra (Ghana), 5-7 November 2007
����������������������� ����������������������������������� ����������������������� ������������������������������������������������������������������� �������������������������������������������������������� ����������� �������������� �������������� ����������������������������������� � Categories Analysis of groups Organizational Str. L TNC - S TNC - FE in terms of Investor origin North - South Market orientation impact, Local - Regional - Global Share structure performance, JV - WOE perception Sub-Sectors Age Donor Committee for Enterprise Development Accra (Ghana), 5-7 November 2007 Growing presence of entrepreneurs and South investors L-TNC S-TNC FE North South 100% 100% 90% 90% 58 100 80% 41 80% 251 255 62 70% 175 70% 184 60% 60% 55 50% 50% 221 40% 40% 135 237 23 69 132 30% 30% 108 85 20% 20% 27 115 10% 10% 32 0% 0% 1980 and 1981-1990 1991-2000 2001 and 1980 and 1981-1990 1991-2000 2001 and before after before after Donor Committee for Enterprise Development Accra (Ghana), 5-7 November 2007
����������������������� �������������� ����������������������������������� ����������������������� ����������������������������������� �������������� Investment vs. employment growth 65% High investment- high “Jobless” growth employment growth 60% firms Post-1990 local market-oriented 55% Future investment over next 3 years (as % of curre FEs Post-1990 50% local market-oriented S-TNCs 45% Post-1990 local market-oriented 40% Other firms L-TNCs Post-1990 35% regional exporters 30% 25% 20% Post-1990 manufacturing Pre-1980 manufacturing 15% global exporters from South L-TNCs 10% 5% Employment- Stagnation intensive growth 0% 0% 2% 4% 6% 8% 10% 12% 14% 16% 18% Future annual employment growth (over next 3 years) Note: Numbers in parentheses indicate the frequencies of firms in the respective group, the bubble size indicates total employment of the respective group. Only companies that answered both variables, future annual investment rate (as % of sales) and future annual employment growth were included. Filtered out were firms with < 50,000 USD sales, with < 20 employees and established in 2003 and after. Donor Committee for Enterprise Development Accra (Ghana), 5-7 November 2007 Investment vs. employment growth 100% High investment- Future investment over next 3 years (as % of current sales) “Jobless” growth Ghana high employment growth firms 90% 80% Nigeria 70% Burkina Faso 60% Mozambique 50% Uganda 40% Guinea Tanzania, UR Senegal Ethiopia Madagascar 30% Mali Cameroon Kenya 20% Malawi 10% Cote d'Ivoire Employment- Stagnation intensive growth 0% 0% 1% 2% 3% 4% 5% 6% 7% 8% 9% 10% 11% 12% 13% 14% Future compound annual employment growth (over next 3 years) Note: Numbers in parentheses indicate the frequencies of firms in the respective group, the bubble size indicates total employment of the respective group. Only companies that answered both variables, future annual investment rate (as % of sales) and future annual employment growth were included. Filtered out were firms with < 50,000 USD sales, with < 20 employees and established in 2003 and after. Donor Committee for Enterprise Development Accra (Ghana), 5-7 November 2007
����������������������� ����������������������� ����������������������������������� �������������� � �������������������������������� � �������������� ����������������������������������� Donor Committee for Enterprise Development Accra (Ghana), 5-7 November 2007 Investors’ evaluations of skilled labour availability Factor Ghana importance Kenya Tanzania, UR Nigeria Ethiopia Uganda Mozambique Cameroon Mali Senegal Madagascar Guinea Malawi Cote d'ivoire Burkina Faso Factor got worse Factor got better Donor Committee for Enterprise Development Accra (Ghana), 5-7 November 2007
Recommend
More recommend