
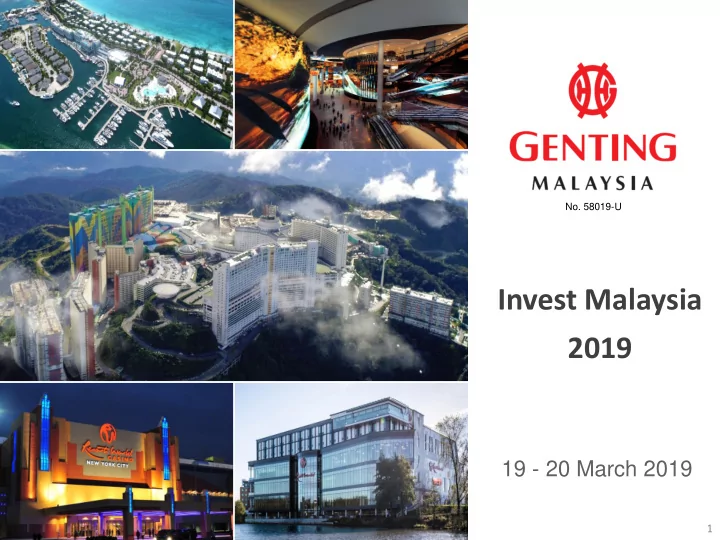
SLIDE 1
19 - 20 March 2019
- No. 58019-U
1
Invest Malaysia 2019 19 - 20 March 2019 1 1 GROUP OVERVIEW 2 - - PowerPoint PPT Presentation
No. 58019-U Invest Malaysia 2019 19 - 20 March 2019 1 1 GROUP OVERVIEW 2 KEY PROPERTIES 3 FINANCIAL HIGHLIGHTS 4 MALAYSIA OPERATIONS 5 OVERSEAS OPERATIONS UNITED KINGDOM & EGYPT US & BAHAMAS 6 PROSPECTS &
19 - 20 March 2019
1
2
GROUP OVERVIEW OVERSEAS OPERATIONS
FINANCIAL HIGHLIGHTS PROSPECTS & FOCUS MALAYSIA OPERATIONS
1 3 4 5 6
KEY PROPERTIES
2
OVERVIEW GENM GROUP CORPORATE STRUCTURE
3 * Genting Malaysia Berhad is a 49.5% owned subsidiary of Genting Berhad
Malaysia
100% 100% 100% 100% 78% 100% 100%
US & Bahamas UK & Egypt
*
4
KEY PROPERTIES GENM
Resorts World Genting, Malaysia Resorts World Casino New York City, US Resorts World Bimini, Bahamas Resorts World Birmingham, UK
5
OVERVIEW FINANCIAL HIGHLIGHTS – 4Q18 & FY18
6
In RM’mil 4Q18 4Q17 % Change FY18 FY17 % Change
Revenue 2,507 2,544 ↓1% 9,928 9,330 ↑6% Adjusted EBITDA 749 670 ↑12% 2,873 2,209 ↑30%
Adjusted EBITDA Margin 30% 26% 29% 24%
Net Profit
(Excl. Mashpee impairment)
705 431 ↑64% 1,748 1,073 ↑63% Net Profit / (Loss) 705 431 ↑64% (86) 1,073 ↓>100%
OVERVIEW
REVENUE & ADJUSTED EBITDA BY GEOGRAPHY – FY18
7
Adjusted EBITDA Revenue
Malaysia 67% UK & Egypt 18% US & Bahamas 15% Malaysia 84% UK & Egypt 5% US & Bahamas 12%
7.13 6.50 7.10 16.50* 17.00* 19.00*
8 12 16 20 FY13 FY14 FY15 FY16 FY17 FY18
Dividend per Share
8
OVERVIEW CAPITAL MANAGEMENT STRATEGY
Dividend
Net dividend per share (sen)
*Include a special dividend of 8.0 sen (FY177 8.0 sen) per share
9.20 7.30 9.00 8.00
Share Buyback
11.00 8.00
9
10
MALAYSIA – LEISURE & HOSPITALITY PERFORMANCE REVIEW – 4Q18 & FY18
In RM’mil 4Q18 4Q17 % Change FY18 FY17 % Change Revenue 1,698.6 1,693.8 Flat 6,594.6 5,836.8 ↑13% Adjusted EBITDA 582.2 597.6 ↓3% 2,297.3 1,806.1 ↑27%
Adjusted EBITDA Margin 34% 35% 35% 31%
11
MALAYSIA – LEISURE & HOSPITALITY PERFORMANCE REVIEW IN FY18
5,684 5,362 5,577 5,623 5,837 6,595
2,000 3,000 4,000 5,000 6,000 7,000 FY13 FY14 FY15 FY16 FY17 FY18
Revenue (RM’mil)
1,972 1,860 1,931 1,942 1,806 2,297 35% 35% 35% 35% 31% 35% 0% 7% 14% 21% 28% 35% 42%
1,000 1,500 2,000 2,500 3,000 3,500 FY13 FY14 FY15 FY16 FY17 FY18
12
MALAYSIA – LEISURE & HOSPITALITY PERFORMANCE REVIEW IN FY18
Adjusted EBITDA (RM’mil) / Margin (%)
13
MALAYSIA RWG KEY STATISTICS IN FY18
(FY17 : 4.2mil)
MEMBERS
DAY-TRIPPERS
(FY17: 72%)
TICKETS SOLD
(FY17: 8.3mil)
VISITORS
(FY17: 23.6m)
14
MALAYSIA RWG HOTEL PERFORMANCE IN FY18
OCCUPANCY
(FY17: 95%) (FY17: RM92)
AVRG ROOM RATE
ROOMS
ROOM NIGHTS SOLD
(FY17: 3.3m)
15
…………Exciting retail and dining experience at 6,000 feet
SKYAVENUE MALAYSIA
16
…..…… Unique dining experience featuring renowned outlets
Harry Ramsden High Line Taiko Ramen RedTail
SKYAVENUE – F&B OUTLETS MALAYSIA
17
CROCKFORDS HOTEL MALAYSIA
…..….. Malaysia’s first and only Forbes 5-star Hotel
18
SKYTROPOLIS FUNLAND MALAYSIA
…..….. Non-stop entertainment for the whole family
Malaysia
19
UK US & Bahamas Egypt
20
21
UK & EGYPT – LEISURE & HOSPITALITY PERFORMANCE REVIEW IN 4Q18 & FY18
In £’mil 4Q18 4Q17 % Change FY18 FY17 % Change Revenue 79.2 90.2 ↓12% 330.1 342.0 ↓3% Adjusted EBITDA 11.5 11.6 Flat 33.8 41.7 ↓19%
Adjusted EBITDA Margin 15% 13% 10% 12%
323 315 227 323 342 330
160 240 320 400 FY13 FY14 FY15 FY16 FY17 FY18
22
UK & EGYPT – LEISURE & HOSPITALITY PERFORMANCE REVIEW – FY18
Revenue (£’mil)
23
24
US & BAHAMAS – LEISURE & HOSPITALITY PERFORMANCE REVIEW IN 4Q18 & FY18
In US$’mil 4Q18 4Q17 % Change FY18 FY17 % Change Revenue* RWNYC and RW Omni 72.6 64.0 ↑13% 297.4 281.4 ↑6% RW Bimini 3.6 4.6 ↓21% 24.1 24.9 ↓3% Total 76.2 68.6 ↑11% 321.5 306.3 ↑5% Adjusted EBITDA* RWNYC and RW Omni 26.3 16.1 ↑63% 103.9 98.2 ↑6% RW Bimini (4.0) (6.7) ↑40% (28.2) (44.3) ↑36% Total 22.3 9.4 ↑>100% 75.7 53.9 ↑40%
Margin 29% 14% 24% 18%
* Before accounting standards adjustments for operating expenses
25
RWNYC – LEISURE & HOSPITALITY PERFORMANCE REVIEW – FY18
240 238 239 250 251 259
120 180 240 300 FY13 FY14 FY15 FY16 FY17 FY18
Revenue (US$’mil)
1 by gaming revenue
26
Artist Impression
RWNYC EXPANSION US
……Transforming RWNYC into a premium integrated resort destination
variety of dining, entertainment and retail experiences
27
Weakening economic sentiments Litigation with 21st Century Fox and Disney
28
MALAYSIA – LEISURE AND HOSPITALITY KEY CHALLENGES
Increase in casino duties
3 2 1
29
LOOKING AHEAD PROSPECTS AND FOCUS
Resorts World Genting
30
UK & Egypt
share
LOOKING AHEAD PROSPECTS AND FOCUS
Resorts World Birmingham Crockfords Cairo
31
US & Bahamas
LOOKING AHEAD PROSPECTS AND FOCUS
RWNYC Resorts World Bimini
32
Disclaimer Some of the statements made in this presentation which are not statements of historical facts are forward-looking statements and are based on the current beliefs, assumptions, expectations, estimates, objectives and projections of the directors and management of the Genting Malaysia Group (“Group”) about its business and the industry and markets in which it operates. These statements are not guarantees of future performance and are subject to risks, uncertainties and other factors some
materially from those expressed or forecast in the forward looking statements as a result of, among other factors, changes in economic and market conditions, changes in the regulatory environment and other business and operational
may arise after publication.