
SLIDE 1
Introduction to Machine Learning Classification: Tasks
0.00 0.05 0.10 0.15 0.20 0.00 0.01 0.02 0.03 0.04 0.05
V1 V2 Response
M R
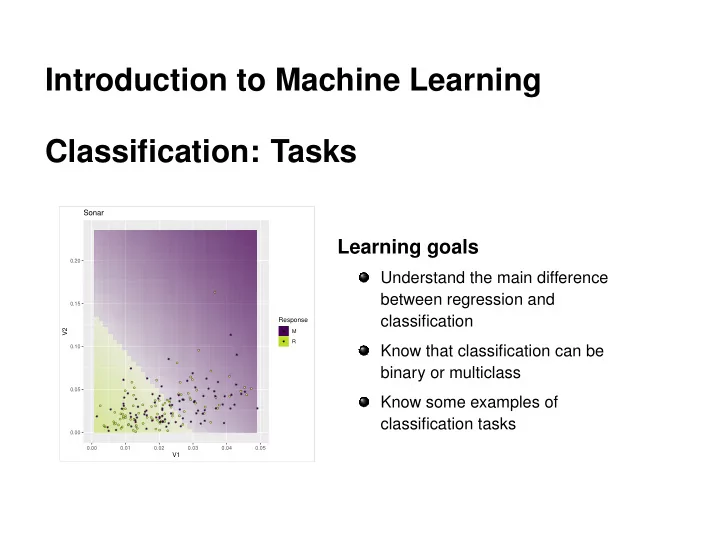
Sonar
Introduction to Machine Learning Classification: Tasks Sonar - - PowerPoint PPT Presentation
Introduction to Machine Learning Classification: Tasks Sonar Learning goals 0.20 Understand the main difference between regression and 0.15 classification Response V2 M R 0.10 Know that classification can be binary or multiclass 0.05
0.00 0.05 0.10 0.15 0.20 0.00 0.01 0.02 0.03 0.04 0.05
V1 V2 Response
M R
Sonar
Sepal Length Sepal Width Petal Length Petal Width Species 5.1 3.5 1.4 0.2 setosa 5.9 3.0 5.1 1.8 virginica
Classifier
Sepal Length Sepal Width Petal Length Petal Width Species 5.4 3.3 3.2 1.1
???
New Data with unknown label New Class label Our Data c
0.00 0.05 0.10 0.15 0.20 0.00 0.01 0.02 0.03 0.04 0.05
V1 V2 Response
M R
Sonar
0.0 0.5 1.0 1.5 2.0 2.5 2 4 6
Petal.Length Petal.Width Response
setosa versicolor virginica
Iris
c
https://www.bendbulletin.com/localstate/deschutescounty/3430324-151/fact-or-fiction-polygraphs-just-an-investigative-tool c
https://symptoms.webmd.com c
c
c
Corr: −0.118 setosa: 0.743*** versicolor: 0.526*** virginica: 0.457*** Corr: 0.872*** setosa: 0.267. versicolor: 0.754*** virginica: 0.864*** Corr: −0.428*** setosa: 0.178 versicolor: 0.561*** virginica: 0.401** Corr: 0.818*** setosa: 0.278. versicolor: 0.546*** virginica: 0.281* Corr: −0.366*** setosa: 0.233 versicolor: 0.664*** virginica: 0.538*** Corr: 0.963*** setosa: 0.332* versicolor: 0.787*** virginica: 0.322*
Sepal.Length Sepal.Width Petal.Length Petal.Width Species Sepal.Length Sepal.Width Petal.Length Petal.Width Species 5 6 7 8 2.0 2.5 3.0 3.5 4.0 4.5 2 4 6 0.0 0.5 1.0 1.5 2.0 2.5 setosaversicolor virginica 0.0 0.4 0.8 1.2 2.0 2.5 3.0 3.5 4.0 4.5 2 4 6 0.0 0.5 1.0 1.5 2.0 2.5 0.0 2.5 5.0 7.5 0.0 2.5 5.0 7.5 0.0 2.5 5.0 7.5
c