introduction
play

Introduction Asthmatic patients in London (Oxford Street versus Hyde - PDF document

30.08.2018 Air pollution and noise from road traffic: acute effects in young healthy subjects A panel study by: Julian Panholzer, Lisa Ulbig, Emanuel Udvarhelyi, Hanns Moshammer (hanns.moshammer@meduniwien.ac.at) Introduction Asthmatic


  1. 30.08.2018 Air pollution and noise from road traffic: acute effects in young healthy subjects A panel study by: Julian Panholzer, Lisa Ulbig, Emanuel Udvarhelyi, Hanns Moshammer (hanns.moshammer@meduniwien.ac.at) Introduction � Asthmatic patients in London (Oxford Street versus Hyde Park): McCreanor J et al. Respiratory effects of exposure to diesel traffic in persons with asthma.N Engl J Med. 2007 Dec 6;357(23):2348-58. � KHK patients and inflammatory markers Mirowsky JE et. Al. Ozone exposure is associated with acute changes in inflammation, fibrinolysis, and endothelial cell function in coronary artery disease patients. Environ Health. 2017 Nov 21;16(1):126. � Diabetics and exhaled NO Li H et al. Acute effects of ambient temperature and particulate air pollution on fractional exhaled nitric oxide: A panel study among diabetic patients in Shanghai, China. J Epidemiol. 2017 Dec;27(12):584-589 � Healthy subjects? Yoda Y et al. Acute effects of air pollutants on pulmonary function among students: a panel study in an isolated island. Environ Health Prev Med. 2017 Apr 4;22(1):33.
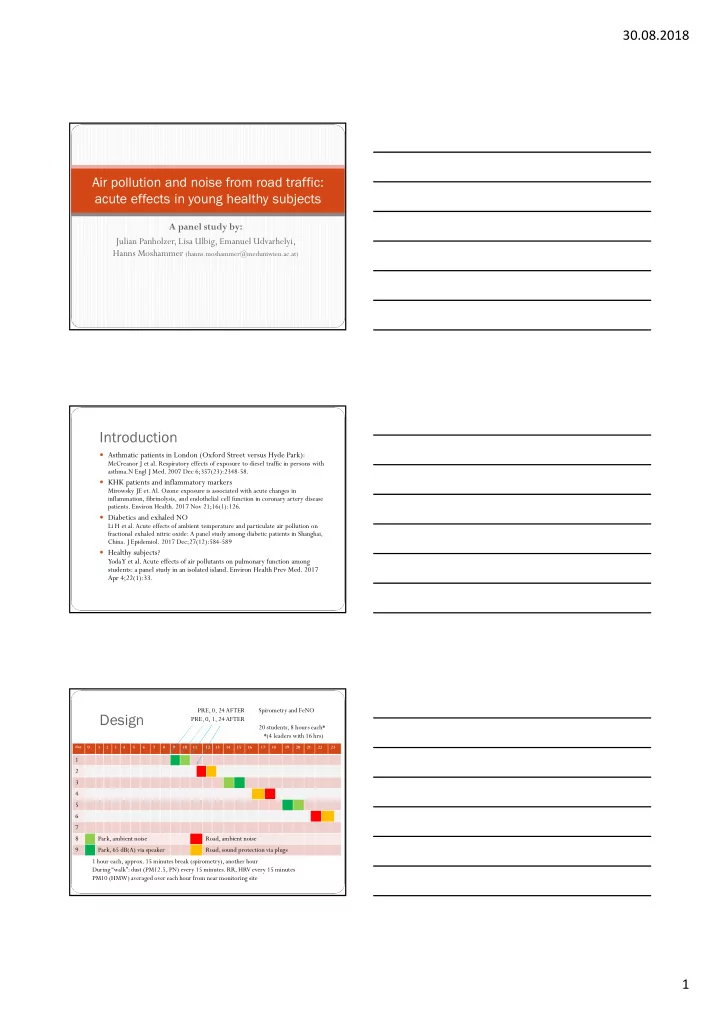
 PRE, 0, 24 AFTER Spirometry and FeNO Design PRE, 0, 1, 24 AFTER 20 students, 8 hours each* *(4 leaders with 16 hrs) day 0 1 2 3 4 5 6 7 8 9 10 11 12 13 14 15 16 17 18 19 20 21 22 23 1 2 3 4 5 6 7 8 Park, ambient noise Road, ambient noise 9 Park, 65 dB(A) via speaker Road, sound protection via plugs 1 hour each, approx. 15 minutes break (spirometry), another hour During “walk”: dust (PM12.5, PN) every 15 minutes. RR, HRV every 15 minutes PM10 (HMW) averaged over each hour from near monitoring site 1

  2. 30.08.2018 Setting Road Monitor („AKH“) Park Exposure 1 hour values each. P always < 0.001 AKH PM10 PM2.5 PM1 PN AKH 0.9367 0.9604 0.9627 0.7698 PM10 0.9367 0.9710 0.9653 0.7624 PM2.5 0.9604 0.9710 0.9994 0.7313 PM1 0.9627 0.9653 0.9994 0.7231 PN 0.7698 0.7624 0.7313 0.7231 PM2.5 = 1.565737*AKH + 4.226977*ROAD - 7.288967 (p 1 , p 3 <0.001, p 2 =0.016; adj R²= 0.9247) PN = 484.7116*AKH + 18536.06*ROAD - 1361.221 (p 1 , p 2 < 0.001, p 3 = 0.163; adj R²=0.82) PM10(AKH) = 28.0 µg/m³ ± 26.5 (5-95) Not much! PM2.5 = 38.7 µg/m³ ± 43.5 (2-146) PN = 21347.8/cm³ ± 18826.5 (4198.9-80059.6) Winter - Spring 15 minutes intervals: PM2.5 and dB (ambient): r= – 0.2595 PM2.5 = 21.30972*ROAD –.2080163*DAY – 111.8313*HOUR + 8994.279 (all p <0.001) PN = 24135.39*ROAD – 65.95211*DAY – 20994.9*HOUR + 2843439 (p HOUR =0.011) dB(A) = 9.903056*ROAD + .0898845*DAY – 2. 385443*HOUR – 3797.16 (p HOUR =n.s.) FeNO and spirometry � NO in exhaled air � From endothelial cells: inflammation & increased blood flow � From epithelial cells: relaxation of bronchial muscle tone � From (eosinophilic) inflammatory cells Irritating agent Neural stimulus Bronchial constriction Epithelial NO � Epithelial NO � Bronchial relaxation (…………..) Tissue inflammation 2

  3. 30.08.2018 FeNO before, Spirometry after � 0, 1, and 24 hours after walk L per ppb FeNO by exposure in ppb Unadjusted FVC by exposure Adjusted for FVC PRE Adjusted for NO PRE in L PRE, 0, 1 hour, 24 hours POST 3

  4. 30.08.2018 Unadjusted FEV1 by exposure Adjusted for FEV1 PRE Adjusted for NO PRE in L PRE, 0, 1 hour, 24 hours POST Unadjusted MMEF by exposure Adjusted for MMEF PRE Adjusted for NO PRE in L/s PRE, 0, 1 hour, 24 hours POST Unadjusted MEF75 by exposure Adjusted for MEF75 PRE Adjusted for NO PRE in L/s PRE, 0, 1 hour, 24 hours POST 4

  5. 30.08.2018 Unadjusted MEF50 by exposure Adjusted for MEF50 PRE Adjusted for NO PRE in L/s PRE, 0, 1 hour, 24 hours POST Unadjusted MEF25 by exposure Adjusted for MEF25 PRE Adjusted for NO PRE in L/s PRE, 0, 1 hour, 24 hours POST Noise & cardiovascular regulation HRV , Blood pressure 5

  6. 30.08.2018 Blood pressure R-R-Interval and SD(R-R) TINN: triangular interpolation of NN interval histogram 6

  7. 30.08.2018 Effects of noise only 7

Download Presentation
Download Policy: The content available on the website is offered to you 'AS IS' for your personal information and use only. It cannot be commercialized, licensed, or distributed on other websites without prior consent from the author. To download a presentation, simply click this link. If you encounter any difficulties during the download process, it's possible that the publisher has removed the file from their server.

Recommend


More recommend