International Markets: Technical Services Demand for Your Issues - - PDF document

international markets
SMART_READER_LITE
LIVE PREVIEW

International Markets: Technical Services Demand for Your Issues - - PDF document

Greg Hanes, USMEF 11/28/17 The Roles of USMEF Marketing Support International Markets: Technical Services Demand for Your Issues Management Trade Servicing Beef In-Market Facilitation Buyer Teams Greg Hanes USMEF Asst.


slide-1
SLIDE 1

Greg Hanes, USMEF 11/28/17 2017 Range Beef Cow Symposium, Cheyenne, Wyo. 1

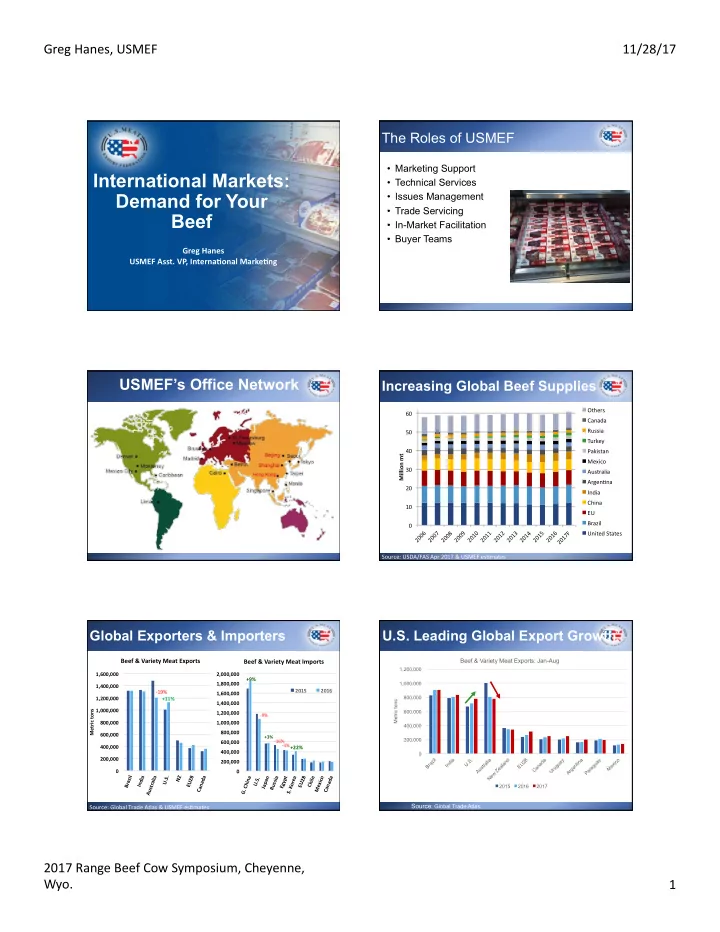
International Markets: Demand for Your Beef

Greg Hanes USMEF Asst. VP, Interna6onal Marke6ng

The Roles of USMEF

  • Marketing Support
  • Technical Services
  • Issues Management
  • Trade Servicing
  • In-Market Facilitation
  • Buyer Teams

USMEF’s Office Network

Increasing Global Beef Supplies

10 20 30 40 50 60 2 6 2 7 2 8 2 9 2 1 2 1 1 2 1 2 2 1 3 2 1 4 2 1 5 2 1 6 2 1 7 F Million mt Others Canada Russia Turkey Pakistan Mexico Australia ArgenSna India China EU Brazil United States Source: USDA/FAS Apr 2017 & USMEF esSmates

Global Exporters & Importers

200,000 400,000 600,000 800,000 1,000,000 1,200,000 1,400,000 1,600,000 Brazil India Australia U.S. NZ EU28 Canada Metric tons

Beef & Variety Meat Exports

  • 19%

+11% 200,000 400,000 600,000 800,000 1,000,000 1,200,000 1,400,000 1,600,000 1,800,000 2,000,000

  • G. China

U.S. Japan Russia Egypt

  • S. Korea

EU28 Chile Mexico Canada

Beef & Variety Meat Imports

2015 2016

  • 9%

+9%

Source: Global Trade Atlas & USMEF esSmates

  • 16%

+22%

+3%

  • 3%

200,000 400,000 600,000 800,000 1,000,000 1,200,000 B r a z i l I n d i a U . S . A u s t r a l i a N e w Z e a l a n d E U 2 8 C a n a d a U r u g u a y A r g e n t i n a P a r a g u a y M e x i c

  • Metric tons

Beef & Variety Meat Exports: Jan-Aug

2015 2016 2017

U.S. Leading Global Export Growth

Source: Global Trade Atlas

slide-2
SLIDE 2

Greg Hanes, USMEF 11/28/17 2017 Range Beef Cow Symposium, Cheyenne, Wyo. 2

U.S. Beef and Variety Meat Exports to Top Markets

50,000 100,000 150,000 200,000 250,000 Japan Mexico Korea Canada China/HK Middle East Taiwan ASEAN South Am Africa EU Carib + DR Central Am

January –September Exports

2015 2016 2017 Metric Tons Source: USDA/FAS & USMEF 2015: 782,369 MT, -12% 2016: 848,930 MT, +8.5% 2017: 926,985 MT, +9% $0.0 $0.2 $0.4 $0.6 $0.8 $1.0 $1.2 $1.4 $1.6 Japan Korea Mexico Canada China/HK Taiwan EU ASEAN Middle East Carib + DR South Am Central Am

January –September Exports

2015 2016 2017 U.S. $ Billion Source: USDA/FAS & USMEF Jan – Sep 2015: $4.766 billion, -8% Jan – Sep 2016: $4.545 billion, -5% Jan – Sep 2017: $5.267 billion, +16%

U.S. Beef Exports - Value

U.S. Beef & Variety Meat Exports to Top Markets

$1,826 $1,236 $983 $839 $774 $411 $260 $216 $198 $183 $159 $94 $- $200 $400 $600 $800 $1,000 $1,200 $1,400 $1,600 $1,800 $2,000 Japan Korea Mexico Canada China/HK Taiwan EU ASEAN Mid East Central & South Am Carib & DR Other Million USD

U.S. Beef & Variety Export Value: Top Markets 2017 F

Beef Exports to Exceed $7 BILLION Again This Year

FTA partner countries account for roughly 45%

  • f U.S. beef export value.

Japan accounts for more than 25%.

Source: USMEF estimates

  • 200,000

400,000 600,000 800,000 1,000,000 1,200,000 1,400,000

2006 2007 2008 2009 2010 2011 2012 2013 2014 2015 2016 2017f 2021f Metric tons

U.S. Beef & Variety Meat Exports

Others ASEAN C/S America Taiwan Middle East China/HK Canada

  • S. Korea

Mexico Japan

Source: USDA/FAS and USMEF estimates

5 year annual average forecast growth rate: 4.2% Jan – Sep 2017: 926,985 MT, +9%

U.S. Beef Exports & Forecast

+7.5% +11%

  • 50,000

100,000 150,000 200,000 250,000 300,000 350,000 U.S. Australia Canada Mexico Brazil Paraguay EU28

Metric tons

Chilled Beef Exports: Jan-Aug

2015 2016 2017

Advantage U.S.A.: World’s Largest Exporter of Chilled Beef

+34%

  • 4%

+5% +5%

  • 13%

+5% +4% Source: Global Trade Atlas

U.S. Dominating Market Share of Chilled Beef Imports

52% 53% 71% 26%

0% 10% 20% 30% 40% 50% 60% 70%

Japan Korea Taiwan Hong Kong U.S. Share of Chilled Beef Imports: Jan-Aug 2003 2015 2016 2017

Source: Global Trade Atlas, USMEF

slide-3
SLIDE 3

Greg Hanes, USMEF 11/28/17 2017 Range Beef Cow Symposium, Cheyenne, Wyo. 3 Composition of U.S. Beef Exports

Short plates, short ribs, chuck rolls, skirts, middle meats & variety meats to Japan, Korea, Hong Kong, Taiwan & S.E. Asia Rounds, clods, skirts & variety meats to Mexico Chuck rolls, rounds, skirts & variety meats to C/S America Variety meats & middle meats to the Middle East Full-sets to the EU

Value of Exports per Fed Head Slaughtered

$0 $50 $100 $150 $200 $250 $300 $350

2003 2004 2005 2006 2007 2008 2009 2010 2011 2012 2013 2014 2015 2016 Jan-Sep 2017

2016: $262.17, -6% Jan – Sep 2017: $277.31, +10% Source: USDA/FAS, fed slaughter

Examples of How Exports Add to Carcass Value

  • Tongues to Japan: $12.62
  • Short plate to Japan: $27.36
  • Short ribs/chuck short ribs to Korea: $19 per

fed head

Source: Global Trade Atlas import data, USDA/NASS, USMEF estimates, data is for Jan – Sept 2017

Japan is contributing over a quarter of export value per head

$76.21 $45.11 $38.27 $31.79 $29.68 $15.66 $40.59

Japan Korea Mexico Canada Hong Kong Taiwan Others Source: USDA/FAS and USMEF, fed slaughter

Jan – Sep 2017 value per fed head of cattle slaughtered = $277.31

5,000 10,000 15,000 20,000 25,000 30,000 35,000 40,000 45,000 50,000 Japan ASEAN China/HK Korea Africa S. America Taiwan Canada Mexico Metric ton increase in exports

Top growth markets for U.S. beef Increase over 2016 volume, Jan-Sep +22% +68% +13% +7% +94% +22% +9% +3% +1%

Japan Top Growth Market

Source: USDA/FAS

“Niku Boom” – Japan’s Demand for Meat is Booming

100,000 200,000 300,000 400,000 500,000 600,000 700,000 800,000 900,000

pork poultry beef

Metric Tons

Japan’s Meat Imports: Jan-Sep

2015 2016 2017

+7% +5% +16%

Source: Global Trade Atlas

slide-4
SLIDE 4

Greg Hanes, USMEF 11/28/17 2017 Range Beef Cow Symposium, Cheyenne, Wyo. 4

Beef Constraints in Japan

Japan - Australia EPA

  • U.S. 38.5% vs. Australia
  • Chilled 29.9%
  • Frozen 27.2%
  • Tongues & skirts 7.6%

(12.8% U.S.)

Beef Safeguard

  • Duty rates from 38.5% to

50% on frozen beef for the remainder of the year through March 31, 2018

  • Increased duty will also

effect Canada and New Zealand

  • Australia, MX not

impacted

  • Australian duty to remain

27.2%

U.S. & Australia Share of Japan’s Total Beef Imports

2% 8% 12% 15% 19% 24% 26% 36% 38% 35% 40% 44% 85% 81% 76% 73% 68% 63% 60% 52% 52% 56% 51% 46%

0% 10% 20% 30% 40% 50% 60% 70% 80% 90% 100% 2006 2007 2008 2009 2010 2011 2012 2013 2014 2015 2016 Jul-17 U.S. Australia

2017 Data based off Jan-July

Source: Global Trade Atlas

Korea: Growth in Beef Consumption

0% 10% 20% 30% 40% 50% 60%

  • 2.00

4.00 6.00 8.00 10.00 12.00 14.00 16.00 2000 2001 2002 2003 2004 2005 2006 2007 2008 2009 2010 2011 2012 2013 2014 2015 2016 2017 Kg per capita, carcass wt. Per capita cons Self-sufficiency

Source: USDA/FAS

Korea Beef FTA Tariff Comparison

2016 2017 2018 2019 2020 2021 2022 2023 2024 2025 2026 2027 2028 U.S. 26.7% 24.0% 21.3% 18.7% 16% 13.3% 10.7% 8% 5.3% 2.7% 0% 0% 0% Aus. 32% 29.3% 26.6% 23.9% 21.3% 18.6% 15.9% 13.3% 10.6% 7.9% 5.3% 2.6% 0% Mex. 40% 40% 40% 40% 40% 40% 40% 40% 40% 40% 40% 40% 40% Can. 34.6% 32% 29.3% 26.6% 24% 21.3% 18.6% 16% 13.3% 10.6% 8% 5.3% 2.6% New Zealand 34.6% 32% 29.3% 26.6% 23.9% 21.3% 18.6% 15.9% 13.3% 10.6% 7.9% 5.3% 2.6%

  • 5,000

10,000 15,000 20,000 25,000 30,000 35,000

United States Australia

Metric tons

Korea’s chilled beef imports: Jan-Sep

2015 2016 2017

Korea Importing Record Volumes

  • f Chilled Beef

Source: Global Trade Atlas; U.S. market share increased from 31% to 41% in 2016

+86%

  • 1%

Importance of NAFTA

  • U.S. beef exports to Mexico and Canada accounted for 30%
  • f U.S. beef export volume at 360,000 mt and 27% of

export value at $1.7 billion in 2016

  • Mexico 2nd largest export destination
  • Canada 4th largest
  • U.S. beef value per fed head of cattle slaughtered from

exports to Canada more than doubled from $13.90 in 1994 to $31.34 in 2016

  • Value per fed head from exports to Mexico nearly

quadrupled from $10.39 in 1994 to $40.30 in 2016

  • Exports to Mexico account for about 3% of U.S. beef

production

  • Beef export value to Mexico has averaged $8.50 per

capita over the past 3 years; and just under 2 kg/person

slide-5
SLIDE 5

Greg Hanes, USMEF 11/28/17 2017 Range Beef Cow Symposium, Cheyenne, Wyo. 5

Growth to NAFTA

Source: USDA/FAS, compiled by USMEF

China Beef General Situation

  • All sectors of domesSc industry profit (cow/calf,

feedlot, packer) while imports rise

  • Per capita annual consumpSon growth >2%
  • Greater acceptance of imports as market ‘balancing’
  • Eligible foreign suppliers expanding
  • Growing preference for chilled beef imports
  • E-commerce imported beef sales increasing
  • The two largest beef companies in China, Kerchin and

Hondo, account for less than 1% of total Chinese beef producSon

China’s Imports Growing Rapidly

100,000 200,000 300,000 400,000 500,000 600,000

2011 2012 2013 2014 2015 2016

Metric tons

China’s Beef Imports Others Canada Argen6na New Zealand Australia Uruguay Brazil

Source: Global Trade Atlas, USMEF

+21.5%

  • 1,000,000

2,000,000 3,000,000 4,000,000 5,000,000 6,000,000 2006 2007 2008 2009 2010 2011 2012 2013 2014 2015 2016 2017f Metric tons, product weight

China’s Beef Situa6on Imports Produc6on Consump6on

Beef Imports Gaining Momentum

Sources: GTA, USDA, USMEF estimates, excludes

Diving into China

U.S. beef at womai.com One of the largest e-commerce platforms begins sales June 22, becoming the first commercial

  • utlet in China selling U.S. beef

USMEF Senior VP Asia Pacific, Joel Haggard Secretary Perdue

US Beef has Returned to Iconic Outlets

slide-6
SLIDE 6

Greg Hanes, USMEF 11/28/17 2017 Range Beef Cow Symposium, Cheyenne, Wyo. 6

200 400 600 800 1,000 1,200 1,400 1,600

1/6 1/20 2/3 2/17 3/3 3/17 3/31 4/14 4/28 5/12 5/26 6/9 6/23 7/7 7/21 8/4 8/18 9/1 9/15 9/29

Metric Tons

U.S. 2017 Weekly Chilled/Frozen Beef Exports

U.S. Beef Exports to Taiwan U.S. Beef Exports to China

Beef exports to China to Remain Relatively Small - Short to med run

Source: USDA/FAS

The Challenge of Full Sets

  • Clod hearts
  • Top butts
  • Ball Tips
  • Trip-tips
  • Chuck Tender
  • Flank
  • Brisket
  • Sirloin Flap
  • Eye of round
  • Chuck eye roll
  • Striploin
  • Heel muscle
  • Bone-in short

rib

  • Culottes
  • Inside skirts
  • Outsides skirts
  • Hanging

Tender

  • Knuckles
  • Inside

rounds

  • Outside

rounds

U.S. More Competitive U.S. Less Competitive

  • Short plate
  • Short rib b/

less

  • Ribeye
  • Tenderloin
  • Chuck roll
  • Finger meat
  • OFFALS

Chilled vs. frozen: Choice vs

The Work Ahead

“HIGH” QUALITY

VALUE ITEMS PREMIUM MASS

Questions?