
SLIDE 1
Interim Results November 2018 Disclaimer This presentation - - PowerPoint PPT Presentation
Interim Results November 2018 Disclaimer This presentation (hereinafter "this document") has been prepared by Hibernia REIT plc (Hibernia, the "Company or Group) for information purposes only. This document has been
2 This presentation (hereinafter "this document") has been prepared by Hibernia REIT plc (“Hibernia”, the "Company“ or “Group”) for information purposes only. This document has been prepared in good faith but the information contained in it has not been independently verified and does not purport to be comprehensive. This document is neither a prospectus nor an offer nor an invitation to apply for securities. No representation or warranty, express or implied, is given by or on behalf of the Company, its group companies, or any of their respective shareholders, directors, officers, employees, advisers, agents or any other persons as to the accuracy, completeness, fairness or sufficiency of the information, projections, forecasts or opinions contained in this presentation. In particular, the market data in this document has been sourced from third parties. Save in the case of fraud, no liability is accepted for any errors,
Certain information contained herein may constitute “forward-looking statements” which can be identified by the use of terms such as “may”, “will”, “should”, “expect”, “anticipate”, “project”, “estimate”, “intend”, “continue”, “target” or “believe” (or negatives thereof) or other variations thereon or comparable terminology. Due to various risks and uncertainties, actual events or results or actual performance of the Group may differ materially from those reflected or contemplated in such forward-looking
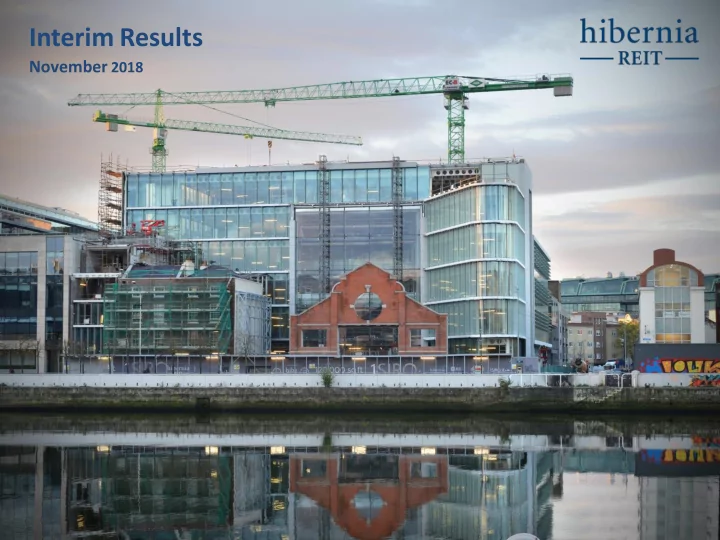
Pictured on cover: 1SJRQ development approaching completion & 50 City Quay, South Docks
3
4
(1) Like-for-like change (incl. finance costs) (2)
(3) Sep-17 metrics do not include increase in stamp duty which took effect in Oct-17
– Majority of space completing in next few weeks
– Interest at Newlands now 143.7 acres – 129 Slaney Road acquired – Office pipeline +8% to up to 543k sq. ft.(1)
years, +5% since Mar-18
– In period: several small acquisitions for €9.7m(2) – Post Sept-18: acquired 92.5 acres of land at Newlands for an initial €27m(2)
€150m(3)
reduction in overheads (IMA expiry in Nov-18) 5
(1) Area post-completion (2) Pre-transaction costs (3) Commitments comprise committed capital expenditure and acquisition of land at Newlands Cross (incl. transaction costs) announced in Nov-18
investors, both domestic and international
– 172k sq. ft. of new offices completing in next few weeks, finishing Windmill Quarter – 50k sq. ft. at Cumberland Place delivering in H1 2020
with €2.0m of this currently under review(1)
significant mixed-use scheme
incremental new office space (previously 227k sq. ft.)
Nov-18 6
(1) Passing rent of leases currently under review is €2.5m (2) Net of committed capex and Newlands Cross land acquisition (incl. transaction costs) announced in Nov-18
7
8 Balance sheet Sep-18 Mar-18 Change Portfolio value €1,329.9m €1,308.7m +3.9% Net debt €163.9m €202.7m (19.1%) Loan to value 12.3% 15.5% (20.6%) Net assets €1,166.3m €1,111.7m +4.9% EPRA NAV per share 166.3c 159.1c +4.5% Income statement Sep-18 Sep-17 Change Net rental income €26.6m €21.9m +21.5% Revaluation and disposal gains €51.1m €61.6m (17.0%) Profit before tax €64.0m €70.6m (9.5%) EPRA earnings €12.8m €9.0m +42.4% EPRA EPS 1.8c 1.3c +38.5% Interim dividend per share 1.5c 1.1c +36.4%
(1) (1) Like-for-like change (incl. finance costs) (2) Sep-17 metrics do not include increase in stamp duty which took effect in Oct-17 (2)
159.1c 166.3c
Resi
1.8c (1.9c) 150 152 154 156 158 160 162 164 166 168 170 Mar-18 Investment properties reval. Development properties reval. Disposal gains EPRA earnings Dividends paid Sep-18 EPRA NAV per share +4.5%
9
(1) Industrial (incl. land) (2) Represents c.€22m of the net property valuation uplift in the period Traditional Core IFSC South Docks 1SJRQ
Valuation uplift: 6.9c Like-for-like “in-place” office valuation:+2.3%(2) (c.100% yield impact)
Other(1)
2.7c 4.2c
2WML
0.4c
10
€9.0m €12.8m €3.3m €1.5m (€1.8m) (€0.3m) €1.1m €0m €2m €4m €6m €8m €10m €12m €14m €16m Sep-17 Completed developments In-place lease events/acqs & disposals Admin costs Finance costs (net) Other Sep-18 EPRA earnings €m +42% Performance related pay (€0.7m) Other admin (€1.1m) Other gains(1) €1.1m 1WML €1.9m 2DC €1.4m Rent from acqs & disposals €0.2m New lettings & rent reviews €0.8m(2) Income from Iconic arrangement €0.5m
(1) Fair value loss on share based payments recognised in the prior year (2) Includes some rent reviews yet to be settled (see slide 36 for further details)
11 Net rental income (NRI) growth
EPRA EPS and dividend growth
0.7 0.75 1.1 1.5 0.8 1.5 1.9 0.0 0.5 1.0 1.5 2.0 2.5 3.0 3.5 FY16 FY17 FY18 FY19 Per share (c) Interim DPS Final DPS EPRA EPS €4.9m €12.5m €16.7m €21.9m €26.6m €12.8m €22.9m €23.8m 5 10 15 20 25 30 35 40 45 50 FY16 FY17 FY18 FY19 NRI (€m) Surrender Premium H1 H2
H1 19 EPRA EPS
12
maturity
Net debt €164m Committed capex €57m
Newlands acquisition €29m
Remaining inv. capacity €150m 50 100 150 200 250 300 350 400 Facility Drawings
Debt capacity (€m)
Hedged €244m LTV 25%(1)
Funding position at 30 September 2018
LTV 18%(1) LTV 12%
€55.6m in the period (primarily New Century House)
Net debt and LTV progression
€53m €111m €155m €181m €203m €164m 0% 5% 10% 15% 20% 50 100 150 200 250 Mar-16 Sep-16 Mar-17 Sep-17 Mar-18 Sep-18 LTV (%) Net debt (€m)
(1) Forecast LTV based on valuers’ estimates of GDV at Sept-18 and includes acquisition spend (incl. transaction costs) at Gateway announced in Nov-18 (2) Pre-transaction costs
€15m €4m €18m €27m €4m €18m €7m €2m €1m €5m €24m 16% 16% 18% 0% 5% 10% 15% 20% 25% 10 20 30 40 50 60 70 Y/E March 2018 (A) Y/E March 2019 (F) Y/E March 2020 (F) LTV (%) €m of capital expenditure 1WML 1SJRQ 2WML Two Dockland Central Cumberland Phase 2 LTV (RHS) FY18 total: €45m FY19 total: €56m FY20 total: €24m
13
(1) Forecast LTV based on valuers’ estimates of GDV at Sep-18 plus factoring in purchase of Gateway lands for €29m (incl. transaction costs) in Nov-18 (2) Hibernia est. all in cost of 1WML on 100% basis is €78m (i.e. €25m all-in land cost plus €53m total capex). (3) €9.4m net of dilapidations received
Completed scheme
Project
capex Spent at Sept-18 Left to spend 1WML €53m €50m €3m Two Dockland Central €11m €11m €0m 1SJRQ €58m €45m €13m 2WML €22m €10m €12m Cumberland Place Ph. 2 €30m €1m €29m Total committed €174m €117m €57m Maintenance capex €3m
(3) (2)
Capex spent H1 19: €23m 1WML €1m 2DC €2m 1SJRQ €14m 2WML €6m
14
Potential incremental rent roll c.€5.3m(1)
(1) Based on Cushman and Wakefield (C&W) ERVs @ Sep-18 (2)
(3) Retail/pub space @ C&W ERV @ Sep-18
Average office ERVs of development space as per C&W @ Sep 18:
€57.50psf (ground floor and above only)
€54.08psf (office only)
Cumberland Place Phase 2
Disposal (NCH) (€2.9m) Acquisitions €0.6m Rent reviews & new leases €0.5m Contracted rent post-1SJRQ letting: €60.9m
(€1.8m) €1.6m(1)
€1.6m
€2m under review €6.8m €0.2m €3.5m €2.8m
30 35 40 45 50 55 60 65 70 75 80 Contracted in- place rent at 31 Mar 18 Movement Contracted in- place rent at 30 Sept 2018 Vacant unlet Reversion Investment pro- forma Let committed schemes Unlet committed schemes Total potential rent roll Rent €m
€74.4m +€20.2m +38% €56.0m(2) €54.2m(2)
2WML 1SJRQ
€61.1m(2) +€6.9m +13%
1SJRQ(3)
15
Scheme Area post completion (sq. ft.) Purchase price (incl. costs) (€m)
(€m) Total cost (€m) Capex to spend at Sept-18 (€m) ERV(2) €m Office(3) (to let) €psf 1SJRQ Office: Retail: 112k 7k €18m €58m €76m €13m €6.7m €57.50 2WML Office: Gym: 60k 12k €21m €22m €43m €12m €3.5m €54.08 Cumberland Place Phase 2 Office: Retail: 50k 1k €0m €30m €30m €29m €2.8m €54.61 Total Office: Other: 222k 20k €39m €110m €149m €54m €13.0m €55.92 Sensitivity of development profits to come from committed schemes(4) Yield 5.25% 5.00% 4.75% 4.50% 4.25% 4.00%
€50.00psf (€37m) (€27m) (€16m) (€4m) €9m €25m €52.50psf (€28m) (€18m) (€6m) €7m €21m €37m €55.92psf (€16m) (€4m) €8m €21m €36m €54m €57.50psf (€10m) €2m €14m €28m €44m €61m €60.00psf (€1m) €11m €24m €39m €55m €73m €62.50psf €9m €21m €34m €50m €67m €86m
Profit left to come based on valuers’ current yields/ERVs
(1) Assuming valuers’ estimate of GDV at September 18 (2) Per valuers’ ERV at September 18 average (3) Office areas only (4) At 31 September 18 C&W, the independent valuer, had an average estimated rental value for the unlet office space (222,000 sq. ft.) in 1SJRQ , 2WML and Cumberland Place Phase 2 of €55.92psf and was assuming an average yield of 4.75% upon completion: based on these assumptions they expect a further c.€8m of development profit (ex. finance costs) to be realised through the completion and letting of the unlet space in these schemes. The entire 112k sq. ft. of office space in 1SJRQ has been let in the intervening period @ €59.75psf (vs. €57.50psf in the September 18 valuations)
16
– EPRA NAVPS +4.5% to 166.3c – TPR of 5.9% vs IPD Ireland Index of 4.4%
– EPRA EPS +38.5%, interim DPS +36.4% – Record contracted rent with more to come in near term from developments & rent reviews – End of IMA in late Nov-18 and move to new remuneration structure will reduce costs
– LTV 12.3%, cash & undrawn facilities of €150m(1) – Expect to extend maturities and diversify sources of debt in the near term – Through-cycle LTV target remains 20-30%
– Expect further uplifts from committed developments – Newlands Cross land purchase likely to have a negative valuation impact in near term performance fee of €2.8m accrued
(1) Net of committed capex and acquisition of land at Newlands Cross (incl. transaction costs) announced in Nov-18
17
% of annual IDA job announcements Country of Origin 2012 2013 2014 2015 2016 2017 2018 France 2% 2% 5% 2% 0% 2% 3% Germany 8% 2% 3% 1% 1% 2% 6% Rest of Europe 1% 3% 0% 2% 8% 2% 8% Rest of World 8% 6% 7% 8% 9% 11% 11% UK 6% 1% 3% 1% 0% 14% 13% US 74% 85% 82% 84% 81% 69% 60%
Source: Project Ireland 20140: National Development Plan 2018-2027 *Skills = “Enterprise, Innovation & Skills”
18
Source: CSO, Goodbody *excl. R&D and aircraft leasing
2015 2016 2017 2018f 2019f 2020f Consumption 3.6% 4.0% 1.6% 3.5% 3.0% 2.9% Investment 50.8% 51.7%
6.2% 5.3% Core Investment* 8.7% 11.2% 6.2% 16.7% 9.5% 7.5% Government 1.4% 3.5% 3.9% 3.8% 3.6% 2.6% Domestic Demand 15.9% 20.6%
0.6% 4.1% 3.6% Core Domestic Demand* 4.0% 5.1% 2.9% 6.0% 4.4% 3.8% GDP 25.1% 5.0% 7.2% 5.9% 3.3% 3.0%
…growing UK FDI though US remains the leader Foreign direct investment continues to flow strongly… Irish economy continues to perform well… …allowing government to plan infrastructure investment
National Development Plan: €115bn capital investment over 10yrs
Sector €bn Comment Energy €22bn Energy investment e.g. renewables, interconnection (€14bn) Education & Skills* €18bn New schools (€8.8bn), universities/higher ed. (€5.1bn) Roads €12bn Motorway, national & regional road upgrades Housing €12bn 112k social homes incl. major regeneration projects in Dublin Healthcare €11bn New Children's Hospital & Maternity Hospital for Dublin Public Transport €9bn Train & bus extension/upgrade and new Metro for Dublin Airports & Ports €4bn
Other €27bn Total €115bn
Source: Goodbody/IDA
2018(YTD) 1,000 2,000 3,000 4,000 5,000 6,000 7,000 8,000 9,000 10,000 Jan Feb Mar Apr May Jun Jul Aug Sep Oct Nov Dec
Number of jobs announced
2012 2013 2014 2015 2016 2017 2018(YTD)
Source: Goodbody/IDA
Other 10% Professional services 6% TMT 45% Financial services 3% Undisclosed 29% Public Sector 7% Other 13% Professional services 10% TMT 31% Financial services 8% Public sector 5% Undisclosed 33%
2m 3m Serviced Office TMT Banking & Capital Markets Other Professional Services Government
Net Take-up Gross Take-Up
19
Active demand @ Mar 18: 5.8m sq. ft. Active demand @ October 18: 5.3m sq. ft.
Source: Knight Frank @ 30 Sep 18 Source: Cushman & Wakefield/Hibernia
4.3% 6.7% 10.1% 6.7% 5.3% 7.9% 8.1% 6.7% 2 4 6 8 10 12 City centre Fringe Suburbs Overall Dublin Vacancy rate (%) Overall vacancy rate Grade A vacancy rate
Source: Knight Frank @ 30 Sep 18
Majority of vacancy remains in suburbs Continued high levels of active demand Strong net absorption underpinning take-up… …with TMT the main driver of demand in 2017 and 2018
0.0m 0.5m 1.0m 1.5m 2.0m 2.5m 3.0m 3.5m 4.0m 2008 2009 2010 2011 2012 2013 2014 2015 2016 2017 To Q3 2018
Million sq. ft.
Net Take-Up Gross Take-Up 10 Yr. Avg. Gross Take-Up
Source: Knight Frank @ 30 Sep 18
All Dublin offices (total market size: 43m sq. ft.) 20
Source: Knight Frank/Hibernia. See appendix for comparison to Mar-18 pipeline.
Dublin CBD offices (total market size: 22m sq. ft.)
All potential schemes Pre-let/let Under construction Completed Probability weighted pipeline
0.2m 1.1m 1.4m 2.3m 1.6m
2.3m 2.2m
0.0m 0.5m 1.0m 1.5m 2.0m 2.5m 3.0m 3.5m 4.0m 2015 (A) 2016 (A) 2017 (A) 2018 (F) 2019 (F) 2020 (F) 2021 (F) Potential sq. ft. Expected year of completion
Knight Frank 2017 take-up = 3.6m sq. ft. Knight Frank 10yr avg. take-up = 2.1m sq. ft.
0.2m 1.0m 0.9m 1.7m 1.0m 2.0m 1.1m 0.0m 0.5m 1.0m 1.5m 2.0m 2.5m 3.0m 3.5m 4.0m 2015 (A) 2016 (A) 2017 (A) 2018 (F) 2019 (F) 2020 (F) 2021 (F) Potential sq. ft. Expected year of completion
Knight Frank 10yr avg. CBD take-up = 1.1m sq. ft. Knight Frank 2017 CBD take-up = 2.2m sq. ft.
60k sq. ft. of the remaining unlet 288k
Source: Knight Frank
# Property Location Buyer Nationality Seller Purchase Price (€m)
1 1 & 2 HSQ Dublin 8 CK Properties Ltd Northwood Investors €175m €802psf 2
Dublin 1 Triuva Ballymore/Oxley €164m €1,146psf 3 Dublin office asset swap Dublin 1 & 2 IPUT/State Street State Street/IPUT €160m n/a 4 The Beckett Building Dublin 3 Kookman Bank Comer Group €101m €532psf 5 Belfield Office Park Dublin 4 Spear Street Capital Colony Northstar €90m €308psf 6 New Century House Dublin 1 Credit Suisse Hibernia REIT €65m €818psf 7 The Sharp Building Dublin 2 Credit Suisse McGarrell Reilly Group €56m €1,260psf 8 One & Three Gateway Dublin 3 Yew Grove REIT Collen Group €29m €306psf 9 31-36 Golden Lane Dublin 8 KGAL MM Capital €26m €823psf 10 Two Haddington Buildings Dublin 4 Quadoro Doric Receiver sale €24m €846psf
21
* Sep 18 vs Sep 17 Source: (1) Knight Frank @ Sept 18; (2) CBRE @ Sept 18 Source: Knight Frank
Change yoy* Sep-17 Mar-18 Sep-18 bps % Office(1) Prime 4.25% 4.00% 4.00%
6.25%
4.88% 4.75% 4.75%
2.74%
5.75% 5.50% 5.50%
4.55% Residential(2) Prime (% net) 4.50% 4.25% 4.00%
12.50% Industrial(2) Prime 5.50% 5.50% 5.25%
4.79%
Yields tightening in Dublin office and residential
Sector Investment demand €bn Office €3.0bn Private Rental Sector €4.0bn Retail €1.0bn Industrial <€0.5bn Total €8.5bn
Robust Dublin investment demand(1) Top 10 office investment transactions (9mths to Sep-18)
(1) As at November 2018
22
at sale date
unleveraged IRR in excess of 12% over 4.5yr hold period
(1) Pre-transaction costs
23
Acquisition price(1): €4.8m (€76.50psf) Acquisition date: Jul-18 Sector: Industrial/development Initial yield: NIY 8.8% (building fully occupied) Area: 62k sq. ft. on 3.8 acres Income €0.5m p.a. (€6.90psf) WAULT 2yrs to break 4yrs to review (fixed RR) 9yrs to expiry Rationale: Strategic location for mixed use/ residential in longer term
24
Acquisition price(1): €2.7m (€635psf) Acquisition date: Jul-18 Sector: Office/office development Initial yield: Acquired vacant Area: 4.5k sq. ft. Rationale: 50 City Quay occupies a prominent location at the entrance to the Windmill Quarter. Potential to improve property in due course
50 City Quay, South Docks, D2 129 Slaney Road, D11
Windmill Quarter 50 City Quay
(1) Pre-transaction costs
25
20 mins
Park & Ride
― 92.5 acres acquired for initial €27m(1,2) in Nov-18 ― 5.8 acres acquired for €1.7m(2) in Aug-18
(mostly zoned “agricultural”)
development plan runs to 2022
(1) Upon rezoning the vendor will be entitled to 44% of combined value of lands, less the €27m already paid, subject to potential min. payments (2) Pre-transaction costs
City Centre <30 mins
N7
To Cork
Owned at Mar-18 Acquired post-Mar-18
26
27
Sector Total area post completion (sq. ft.) Full purchase price Capex/Est. capex
(incl. land) €psf ERV(1) Office ERV psf(1) Expected PC Date Schemes completed in 12 months to 31 March 18 1WML Office 124k office 8k retail 7k reception 14 resi. units €25m €53m €554psf(2) €7.6m(3) €52.59psf(2)
Two Dockland Central Office 73k(5) office €46m €11m(6) €760psf(7) €4.1m €52.45psf(8)
>35%(4)
Total completed 197k office 8k retail 7k reception 14 resi. units €71m €64m(9) €11.7m Committed schemes 2WML Office 60k office 12k gym €21m €22m €678psf(2) €3.5m €54.08psf(2) Q4 2018 1SJRQ Office 112k office 7k food & beverage €18m €58m €639psf(2) €6.7m €57.50psf(2) Q1 2019 Office space fully let Cumberland Place Phase 2 Office 50k office 1k retail/café €0m €30m €600psf(2) €2.8m €54.61psf(2) H1 2020 Total committed 222k office 20k retail/gym €39m €110m €13.0m
(1) Per C&W valuation at 30 September 18 (2) Office demise only (3) Commercial (incl. reception/townhall) and net residential (4) Assuming 6% stamp duty and no finance costs @ Sep-17 values (5) 57k sq. ft. is completed refurbishment of entire 73k sq.ft. (6) €9.4m net of dilapidations received (7)
(8) For entire 73k sq. ft. (9) €62.4m net of dilapidations received
1SJRQ and 2WML –
– Gym, retail (food & beverage) and residential units
– Due to complete early 2019 – 112k sq. ft. office fully let to HubSpot from June 19 – 20yr lease, rent of €6.8m (€59.75psf) – Retail (ERV €0.2m) to let
– Due to complete end-2018 – 12k sq. ft. gym let to Perpetua for rent rising to €0.2m p.a. by year 3 – Discussions ongoing for the 60k sq. ft. of offices (ERV €3.3m)
Windmill Quarter: Hibernia-owned properties 1. 1SJRQ 3. 2WML 5. 50 City Quay 2. 1WML & Hanover Mills 4. Observatory
28
to 1 Cumberland Place
Sector Current area (sq. ft.) Area post completion (sq. ft.) Full purchase price Comments Offices Blocks 1, 2, & 5 Clanwilliam Court and Marine House Office 139k 200k €80m
an office cluster similar to Windmill Quarter
Harcourt Square Office 117k on 1.9 acres 315k €72m
ft.), subject to appeal One Earlsfort Terrace Office 22k 28k €20m
Total offices 278k 543k €172m Mixed-use Gateway & Newlands Cross 143.7 acres N/A €48m(1)
129 Slaney Road 62k on 3.8 acres N/A €5m
Total mixed-use 147.5 acres N/A €53m
30
(1) Initial consideration including transaction costs
31
32
% of portfolio Initial Equivalent Reversionary Passing Rent (€m) Contracted Rent (€m) ERV (€m)
Traditional Core €447m 34% 5.1% 5.2% 5.4% €21.6m €21.6m €25.0m IFSC €204m 15% 4.6% 4.8% 4.8% €10.3m €10.3m €11.1m South Docks €334m 25% 3.8% 4.8% 4.9% €14.0m €15.4m €18.1m Total Dublin CBD Offices €985m 74% 4.5% 5.0% 5.1% €45.9m €47.3m €54.2m
€173m 13%
€13.0m
€148m 11% 3.6% 4.0% 4.4% €5.6m €5.6m €6.8m
€24m 2% 4.4% 4.4% 4.8% €1.1m €1.3m €1.3m Total Investment Properties (incl. offices) €1,330m 100% 4.4% 4.8% 5.0% €52.6m €60.9m €75.3m Value as at Sept-18 (all assets) Yield on Value %
(4) (3) (2,6,8) (2,6,8) (2,6,8) (1) Yields on unsmoothed values and excluding the adjustment for South Dock House owner-
(2) Harcourt Square yield is the yield on the total value which includes residual land value (3) Excludes the value of space occupied by Hibernia in South Dock House (4) Includes 2WML, 1SJRQ & Cumberland Place Phase 2 (5) Includes 1WML residential element (Hanover Mills) (5) (2) (2) (2) (6) (6) (6) (7) (7) (2) (2) (2) (1) (9) (9) (6) These are the net yields assuming 80% net-to-gross and purchaser costs. C&W has valued Wyckham Point, Dundrum View, Cannon Place and Hanover Mills on a gross yield basis excl. acquisition and management costs: gross initial yield is 4.7% and gross market reversion is 5.7% (7) Current rental value assumed as ERV as these assets are now being valued on a price per acre basis (8)
(9) Residential rent on a net basis assuming 80% net-to-gross (10) As per valuer’s ERV @ Sep-18. 1SJRQ ERV based on office rents of €57.50psf which is lower than the rent achieved (11) Net ERV assuming 80% net to gross (as per valuer assumptions) (12) To reconcile with “Total potential rent roll” on slide 14: €75.3m total investment properties ERV less €1.2m incremental net residential reversion (€6.8m - €5.6m) plus €0.3m additional rent above ERV from SJRQ letting i.e. €75.3m - €1.2m + €0.3m = €74.4m (10) (12) (11) (9)
Capex Value as at Sep-18 (all assets) LFL change (€m) LFL change (%)
Traditional Core €436m
€447m €11m 2.5% IFSC €261m €2m
€3m €204m €3m 1.3% South Docks €322m €1m €3m
€334m €8m 2.5% Total Dublin CBD Offices €1,019m €3m €3m (€62m) €22m €985m €22m 2.3%
€134m €20m
€173m €18m 11.9%
€138m
€148m €9m 6.6%
€18m
€24m
Total Investment Properties (incl. offices) €1,309m €23m €11m (€62m) €48m €1,330m €49m 3.9% Value as at March-18 (all assets) Disposals Acquisitions Revaluation
33
(1) (2) (1) Including acquisition costs (2) As at March 2018 valuation (smoothed). Sale price was €65.3m and net proceeds after sales costs were €65.0m (3) Excludes the value of space occupied by Hibernia in South Dock House (3) (3)
34
Insurance & Reinsurance 2% TMT 45% Professional Services 9% Government Agency 22% Banking & Capital Markets 15% Serviced Office 5% Other 2% 13% 11% 8% 6% 4% 4% 4% 4% 4% 3%
39% Remainder
TMT Tenant
In-place office portfolio 987k sq. ft. Committed developments (let) 112k sq. ft. Committed developments (to let) 111k sq. ft. Longer term pipeline 265k sq. ft.
Sept-17 Mar-18 Sept-18 All office contracted rent(1,2,4) €43.5m +14% €49.6m +9% €54.0m In-place office contracted rent(1,4) €41.3m +23% €49.6m
€47.3m In-place office WAULT(3) 6.9yrs +6% 7.3yrs
7.1yrs(5) In-place office vacancy(4) 10%
3%
(1)
(2) Including pre-let of 1SJRQ (3) To earlier of break or expiry (4) By net lettable office area. Office area only (i.e. excl. retail, basement space, gym, townhall etc.) (5) Increases to 7.7 years with inclusion of 1SJRQ pre-let and extension of break option in 1&2DC
€47.3m
1.5m sq. ft.(1)
Portfolio by area(1) Top 10 tenants of in-place portfolio Industry split of in-place tenants
€47.3m
(1) Office areas only (i.e. excl. retail, basement space, gym, townhall etc.)
35
Contracted rent (€m/€psf) ERV (€m/€psf) WAULT to review(1) (yrs) WAULT to break/expiry (yrs) % of rent upwards
% of next rent review cap & collar % of rent MTM(2) at next lease event Acquired in-place office portfolio €26.7m(€41psf) €32.0m(€49psf) 2.5yrs 4.5yrs 16% 7% 77% Completed office developments(3) €20.5m(€52psf) €20.6m(€52psf) 3.6yrs 10.5yrs(4) 0% 35% 65% Whole in-place office portfolio €47.3m(€45psf) €52.6m(€50psf) 3.0yrs 7.1yrs 9% 19% 72% Let committed schemes(5) €6.8m(€60psf) €6.7m(€58psf) 5.0yrs 12.0yrs 0% 0% 100% Whole office portfolio €54.0m(€46psf) €59.3m(€51psf) 3.2yrs 7.7yrs(4) 8% 17% 75%
(1) To earlier of review or expiry (2) Mark-to-market (3) 1 Cumberland Place, SOBO Works, 1&2DC, 1WML (4) Including extension of break option in 1&2DC agreed as part of 1SJRQ letting (5) 1SJRQ
Office portfolio statistics
36
Tenant Building Area (sq. ft.) Lease type Contracted rent €m Contracted rent vs. ERV at Mar-18 Notes % of Group rent To expiry To break Observatory 1k New lease €0.1m +20% <1% 10yrs 5yrs
1SJRQ 112k New lease €6.8m +5% 11% 20yrs 12yrs
Total 113k €6.9m +5%
Tenant Building Review date Rent @ review ERV @ review Rent achieved Notes €m €psf €m €psf €m €psf Media Observatory Feb-17 €0.3m €23 €0.6m €52 €0.7m €56
ahead of ERV at review Total €0.3m €0.6m €0.7m Rent achieved was 143% ahead of previous contracted rent
Office leases agreed since Mar-18
Building Review date Area (sq. ft.) Contracted rent €m Contracted rent €psf % of Group Contracted Rent ERV €m ERV €psf % change Notes Hardwicke House Jul-18 37k €1.2m €30psf 2% €2.0m €52psf +71%
Montague House May-18 45k €1.2m €25psf 2% €2.3m €50psf +93%
Marine House Jun-18 4k €0.1m €20psf <1% €0.2m €45psf +98%
Total 86k €2.5m 5% €4.5m +83%
Office leases under review at Sep-18 Office rent reviews agreed since Mar-18
37
38
39
40
20
41
Key: Office Residential Industrial Office development Croke Park Fairview Park River Liffey Kings Inns St. Stephens Green 8 6 7 11 12 3 4 10 9 14
1 Wyckham Point 2 Gateway & Lands 3 Montague House 4 Hardwicke House 5 77SJRQ 6 2WML 7 1WML 8 Observatory 9 Two Dockland Central 10 One Dockland Central 11 The Forum 12 1SJRQ 13 Cumberland Place 14 Harcourt Square 15 Dundrum View 16 Central Quay 17 One Earlsfort Terrace 18 Marine House & Clanwilliam Court 19 Cannon Place
2
M1 M50 M50 N3/M3 N2/M2 M50
Dublin
N81
Howth Clontarf Dublin Airport North Bull Island Portmarnock Blanchardstown Clondalkin Tallaght Blackrock Ballsbridge Rathfarnham Phibsborough Drumcondra Castleknock Sutton Northern Cross Beaumont Ballymun The Ward Northwest Business Park Glenageary Dundrum Palmerstown Kimmage
N11
Ballymount
N4/M4 N7/M7
1 Wyckham Point 2 Gateway & Lands 15 Dundrum View 19 Cannon Place
1 &15 2 16 17 18
CBD
1 &15 Herbert Park Source: Google Maps, Visit Dublin, Jones Lang LaSalle (1) Property assets > €5m in value as at 30 September 2018
Dublin Overview(1) Central Dublin portfolio(1)
13 19 19 5
42
€ '000
6 mths to 30-Sep-18 6 mths to 30-Sep-17 Revenue 30,656 25,928 Rental income 28,134 23,579 Property expenses (1,502) (1,715) Net rental income 26,632 21,864 Performance related fees (2,841) (2,179) Administrative expenses (7,603) (6,501) Net finance (costs) (3,390) (3,081) Net rental profit 12,798 10,103 Revaluation & other income/(expense): Investment properties revaluation gains 48,734 61,626 Investment property disposal gain 2,397
34 (1,082) Tax (expense) (3) (43) Total revaluation/other income: 51,162 60,501 Profit for the period 63,960 70,604 Diluted IFRS EPS (cents) 9.2 10.2 EPRA Earnings 12,849 9,024 EPRA EPS (cents) 1.8 1.3
€ '000
30-Sep-18 31-Mar-18 Investment properties 1,329,925 1,308,717 Assets held for sale 534 534 Other non current assets 13,575 13,438 Cash and cash equivalents 54,316 22,521 Trade and other receivables 2,771 7,239 Gross assets 1,401,121 1,352,449 Current liabilities (23,586) (22,310) Financial liabilities (non-current) (211,269) (218,409) Net assets 1,166,266 1,111,730 Equity share capital 694,242 686,696 Retained earnings 517,771 453,825 Dividends paid (51,665) (38,411) Other reserves 5,918 9,620 Total equity 1,166,266 1,111,730 IFRS NAV per share (cents) 167.2 160.6 Diluted IFRS NAV per share (cents) 166.3 159.1 EPRA NAV per share (cents) 166.3 159.1
Balance sheet highlights Summary income statement
(1)
(1) Fair value loss on share based payments recognised in the prior year
€0.0m €1.0m €2.0m €3.0m €4.0m €5.0m €6.0m €7.0m €8.0m €9.0m €10.0m Sep-18 Mar-19 Sep-19 Mar-20 Sep-20 Mar-21 Sep-21 Mar-22 Sep-22 Mar-23 Sep-23 Mar-24 Contracted rent Six months ended
43
To earlier of rent review or lease expiry
(1) To earlier of rent review or lease expiry. Excludes various parking licenses, retail space in office buildings, Park Rite in the Forum/Clanwilliam & AIB ATM. Also excludes any rent review dates or expiries prior to Mar-18 (2) i.e. the ‘acquired in-place’ office portfolio (3) Note: OPW ERV in Mar-23 is internal Hibernia assessment
TMT Tenant (3)
44 Top 10 Hibernia occupiers by contracted rent
Tenant Business Sector Contracted Rent (€m) % of Group Rent Unexpired Term (years) The Commissioners of Public Works Government Agency 6.0 9.9% 4.3 Twitter International Company TMT 5.1 8.3% 9.9 Hubspot Ireland Limited TMT 3.8 6.2% 9.2 TMT Tenant TMT 2.8 4.7% 11.5 Informatica Ireland EMEA TMT 2.1 3.5% 11.3 Depfa Bank plc Banking & Capital Markets 2.0 3.4% 0.5 Electricity Supply Board Government Agency 1.9 3.1% 2.7 Travelport Digital Limited TMT 1.8 3.0% 9.1 IWG Serviced Office 1.8 3.0% 14.5 BNY Mellon Banking & Capital Markets 1.6 2.6% 6.5 Top 10 Tenants 29.0 47.6% 7.8 Remaining Tenants 31.9 52.4% 6.9 Total Portfolio 60.9 100.0% 7.4
Top 10 Dublin office lettings in first nine months of 2018
Tenant Industry Building Area (sq. ft.) % of total take-up Google TMT Bolands Quay, D2 221k 13% IDA State Three Park Place, D2 112k 7% WeWork Serviced
No.2 Dublin Landings, D1 100k 6% WeWork Serviced
One Central Plaza, D2 74k 4% Google TMT One Grand Canal Quay, D2 58k 3% Google TMT The Chase Building, D18 53k 3% WeWork Serviced
5 Harcourt Road, D2 49k 3% Google TMT Blackthorn Building, D18 49k 3% TMT tenant TMT 1WML, D2 48k 3% Perrigo Pharma The Sharp Building, D2 45k 3% Total 849k 49k 38% 38%
Source: Knight Frank
45
Source: Knight Frank/Hibernia
Dublin CBD office development pipeline Total Dublin office development pipeline (incl. suburbs)
All potential schemes Pre-let/let Under construction Completed Probability weighted pipeline
0.2m 1.1m 1.4m 2.3m 1.7m 2.0m 1.4m 0.0m 0.5m 1.0m 1.5m 2.0m 2.5m 3.0m 3.5m 4.0m 2015 (A) 2016 (A) 2017 (A) 2018 (F) 2019 (F) 2020 (F) 2021 (F) Potential sq. ft. Expected year of completion
Knight Frank 2017 take-up = 3.6m sq. ft. Knight Frank 10yr avg. take-up = 2.1m sq. ft.
0.2m 1.0m 0.9m 1.8m 1.1m 1.8m 0.5m 0.0m 0.5m 1.0m 1.5m 2.0m 2.5m 3.0m 3.5m 4.0m 2015 (A) 2016 (A) 2017 (A) 2018 (F) 2019 (F) 2020 (F) 2021 (F) Potential sq. ft. Expected year of completion
Knight Frank 10yr avg. CBD take-up = 1.1m sq. ft. Knight Frank 2017 CBD take-up = 2.2m sq. ft.
1SJRQ: 112k sq. ft. 2WML: 60k sq. ft.