
SLIDE 1
Interim report Q3 2019
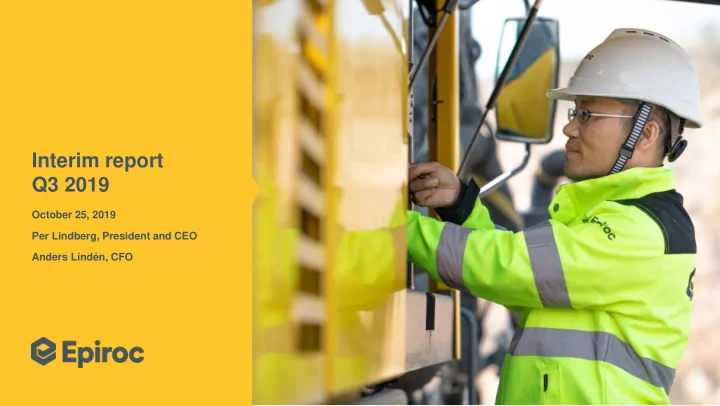
October 25, 2019 Per Lindberg, President and CEO Anders Lindén, CFO
Interim report Q3 2019 October 25, 2019 Per Lindberg, President - - PowerPoint PPT Presentation
Interim report Q3 2019 October 25, 2019 Per Lindberg, President and CEO Anders Lindn, CFO Growth in aftermarket, lower equipment demand Key highlights Q3 2019 Strong aftermarket - High customer activity Solid and improved underlying
October 25, 2019 Per Lindberg, President and CEO Anders Lindén, CFO
– Revenue mix positive
management, and for battery-electric vehicles
– Infrastructure relatively weaker than mining
– Restructuring in Tools & Attachments
2
19.1 18.6 20.0 18.1 18.4 18.4 19.7 20.5 19.7 21.3 19.0 5 10 15 20 25 30 2 000 4 000 6 000 8 000 10 000 12 000 Q1 2017 Q1 2019 1 414 9 651 1 468 Q2 2017 Q3 2017 1 898 Q4 2017 1 528 10 626 Q1 2018 1 515 1 810 Q2 2018 Q3 2018 1 520 Q4 2018 1 930 2 263 7 411 Q2 2019 1 927 Q3 2019 8 233 7 879 7 610 8 464 9 843 10 558 9 785 10 158 2 162 Operating margin, %
Operating Profit, MSEK Revenues, MSEK
Revenues, operating profit and margin
– Currency and acquisitions contributed positively – Restructuring costs of MSEK 179 in Tools & Attachments
– Adjusted for restructuring costs and LTI at 21.3%
3
9 000 9 400 9 200 9 600 Currency Organic +3% +5%
Q3 2018 9 413 9 600 Q3 2019 Structure & Other +2%
Orders received, MSEK, and change %
automation and information management solutions
won in Chile with possible implementation of automation features
Scooptram ST14 Battery and Minetruck MT42 Battery at Agnico Eagle’s Kittilä mine, Finland. The batteries are supplied from Northvolt, aiming for minimal carbon footprint and the highest levels of recycling
the coming quarters and expected to give visible effects in the first half of 2020
Tools & Attachments
– Positive trend in reducing work-related injuries
– “Speak Up” launched
– Epiroc Days – Leaders committed to value creation for all stakeholders
– CO2 emissions from transport improved – Energy/CoS decreased
6
32% 41% 27%
Revenues in the quarter
Equipment Service Tools & Attachments
Aftermarket (63)
7
2 285 3 589 2 665 3 601 4 147 2 727 Q3 2019 Service Q3 2018 Equipment Tools & Attachments 9 413 9 600 +2% / -6%
Order intake, MSEK and growth, % (Total growth / Organic growth)
+16 / +11 +17 / -3
– High customer activity
– Investment decisions postponed – Cancellation of large order
– Supported by currency
– Positive revenue mix
8
7 200 6 600 6 800 7 000
Currency
Structure & Other Q3 2018 Q3 2019 7 190 6 874 +5% Organic
Orders received, MSEK and change, %
6 200 6 323 6 263 5 788 7 442 7 947 7 190 7 116 7 248 7 677 6 874 5 220 5 495 5 406 6 262 5 943 7 325 7 178 8 094 7 115 7 702 7 334 2 000 4 000 6 000 8 000 10 000 25 24 26 23 27 28 29 30 22.6 25.6 Q4 2018 23.9 Q1 2018 26.3 Q2 2017 22.3 Q1 2017 Q3 2017 Q3 2019 23.0 Q2 2018 Q4 2017 23.3 24.6 Q3 2018 23.2 24.2 22.9 Q2 2019 Q1 2019 Operating margin, % Order intake, MSEK Revenues, MSEK
Orders received, revenues and operating margin
– Rock drilling tools orders negatively impacted by
– Hydraulic attachment tools decreased organically
– Restructuring cost of MSEK 179
– Collection claim towards distributor, provision of MSEK -41
9
2 300 2 400 2 500 2 600 2 700 2 665 +15% Q3 2018 2 285 Structure & Other Organic +5% Currency Q3 2019
+17%
Orders received, MSEK and growth, %
2 341 2 270 2 239 2 197 2 550 2 470 2 285 2 306 2 760 2 826 2 161 2 297 2 141 2 139 2 245 2 452 2 382 2 440 2 605 2 765 14.8 14.3 13.0 10.2 12.8 12.4 13.6 13.3 14.2 14.6 2 4 6 8 10 12 14 16 18 1 000 2 000 3 000 4 000 5 000 6 000 Q3 2017 Q4 2017 Q1 2017 Q2 2017 Q1 2018 Q2 2018 Q4 2018 Q3 2018 Q1 2019 Q2 2019 5.7 Q3 2019 2 926 2 665
Order intake, MSEK Revenues, MSEK Operating margin, %
Orders received, revenues and operating margin
Operating profit and margin
11
* Q1 2017-Q4 2018 includes costs related to the split from Atlas Copco. * Q1 2017-Q3 2019 includes change in provision for long-term incentive plans. * Q3 2019 includes restructuring costs of MSEK 179 in Tools & Attachments.
1 414 1 468 1 520 1 528 1 515 1 810 1 898 2 162 1 930 2 263 1 927 181 233 19.1 18.6 20.0 18.1 18.4 18.4 19.7 20.5 19.7 21.3 19.0
2 4 6 8 10 12 14 16 18 20 22 24 1 000 1 500 3 000 2 000 500 2 500 3 500 4 000 Q3 2018 Q1 2017 Q2 2018 45 53 Q2 2017 1 610 15 Q3 2017 50 Q4 2017 Q4 2018 Q1 2018 126
59 Q1 2019 39 Q3 2019 Q2 2019 1 459 1 521 1 535 1 578 1 991 2 024 2 154 1 989 2 302 2 160 95 Operating margin, % Items affecting comparability*, MSEK Operating profit, MSEK Operating margin, adj., %*
Operating profit and margin
12
54 2 000 2 200 1 950 1 900 1 850 2 250 2 050 50 2 150 2 100 Reported
1 898 1 927 2 160 2 201 Q3 2018 +41 Restructuring Underlying margin +89
Organic +179 Structure and other Collection claim Currency
+3 +0.7pp Q3 2019 LTI +2% +14% +16%
Margin: 19.7% Margin: 19.0% Underlying margin: 21.7%
“Structure and other” includes operating profit/loss from acquisitions and contract manufacturing MSEK 55, one-time items MSEK -120 (restructuring costs of -179 + net split costs of +59 = -11-(-70), and change in provision for long- term incentive programs MSEK +2 = -54-(-56) “Items affecting comparability” includes change in provision for long-term incentive programs MSEK -54 and restructuring costs of MSEK 179 in Tools & Attachments. Provision for collection claim of MSEK -41 is included in “Organic”.
13
1 860 1 820 1 920 1 840 1 940 1 900 1 880 20 1 740 1 760 1 780 1 800 Q3 2018 +102 +1.7pp Organic Currency +5 +0.3pp 1 932 Structure and other Q3 2019 1 764 +61
+10%
Margin: 24.6% Margin: 26.3%
14
260 200 240 280 380 140 20 220 360 340 160 320 180 300 157 377 +50 +1.4pp +41 Restructuring Structure and other
Collection claim Reported
336 Organic Currency
Q3 2018 +179 Underlying margin Q3 2019 324
Margin: 13.6% Margin: 5.7% Underlying margin: 13.6%
– Growth, but also some inefficiencies – Acquisitions and currency – Expenses adjusted for change in provision for LTI MSEK -54 (-56) – Expenses adjusted for restructuring costs MSEK 62
– Interest net was MSEK -54 (-34)
– Effective tax rate 28.1% (24.1), affected negatively by the restructuring costs in Tools & Attachments – Guidance: below 25%
Administration, marketing and R&D expenses
15
1 239 1 277 1 169 1 348 1 386 1 569 1 482 1 637 1 663 1 745 1 671 16.7 16.2 15.4 15.9 16.8 15.9 15.4 15.5 17.0 16.4 16.5 5 10 15 20 25 30 500 1 000 1 500 2 000 Q4 2018 Q3 2017 Q2 2018 Q1 2017 Q2 2017 Q1 2018 Q4 2017 Q3 2018 Q1 2019 Q2 2019 Q3 2019 Expenses in % of revenues A, M and R&D expenses, adj. for change in LTI provisions and restructuring, MSEK
– Post-employment benefits MSEK 640 (212)
– SEK 1.05 per share – Ex-date Oct. 29
16
Net debt and Net debt/EBITDA
2 550 3 027 3 146 1 208 1 659 2 092 404 1 982 2 125 2 012 0.35 0.40 0.39 0.39 0.43 0.00 0.05 0.10 0.15 0.20 0.25 0.30 0.35 0.40 0.45 0.50 500 1 000 1 500 2 000 2 500 3 000 3 500 4 000 4 500 5 000 5 500 6 000 Q3 2019 0.24 Q4 2018 Q2 2018 Q1 2018 Q3 2018 0.14 Q1 2019 Q2 2019 2 416 3 641 4 217 Net debt, MSEK, end of period Net debt/EBITDA ratio Net debt, IFRS 16, MSEK, end of period
* Numbers for 2018 not restated for IFRS 16.
– Increase of 11% due to currency and acquisitions – Both trade receivables and inventories decreased, while this improvement was more than offset by lower payables.
– IFRS 16 impact 1.0 percentage points
17
Capital employed and ROCE Net working capital
9 991 12 158 14 124 13 465 15 120 31.9 31.8 34.3 31.9 34.3 10 20 30 40 50 5 000 10 000 15 000 20 000 25 000 30 000 2018 2017 Q3 2019 Q3 2018 Q3 2019
Avg.NWC, MSEK End of period, NWC, MSEK
21 674 23 086 28 050 24 501 27.4 32.0 29.5 30.9 29.5 10 20 30 40 10 000 20 000 30 000 40 000 50 000 2017 Q3 2019 Q3 2019 2018 Q3 2018 31 101
ROCE, 12m, % End of period, capital employed, MSEK
MSEK Q3 2019 Q3 2018 Operating profit +1 927 +1 898 Depreciation, amortization and impairment +556 +362 Capital gain/loss and other non-cash items
+199 2 379 2 459 Net financial items received/paid
Taxes paid
Change in working capital +126
Investments, incl. rental equipment*
Pension funding and other** +122
Operating cash flow 1 883 777 Acquisitions and divestments +33
18
* Investments include rental investments, net, other PPE, net, intangibles and other financial assets, net. ** Other includes currency hedges of loans.
1 111 1 313 1 242 944 666 199 777 2 242 472 1 506 1 883 1 049 1 078 1 104 1 081 1 321 1 412 1 623 1 374 1 680 10 20 30 40 50 60 70 80 90 100 200 400 600 800 1 000 1 200 1 400 1 600 1 800 2 000 2 200 2 400 Q2 2018 Q1 2018 Q4 2018 Q4 2017 Q1 2017 Q3 2018 Q2 2017 Q3 2017 Q1 2019 Q2 2019 Q3 2019 1 067 1 341 Operating cash flow, MSEK Net proft, MSEK
Operating cash flow and Net profit
– Revenue mix positive
management, and for battery-electric vehicles
– Infrastructure relatively weaker than mining
– Restructuring in Tools & Attachments
20
Disclaimer - Some statements in this presentation, or in conclusion to it, are forward-looking and the actual outcome may be different. In addition to the factors explicitly commented upon, the actual
exchange- and interest-rates, political risks, competitor behavior, supply- and IT-disturbances.
26
North America 23%
* Rolling twelve months , Orders received excluding corporate.
69% 66% 34% 34% 2018 2017 31% 66% 2019 Q2* 7 481 8 814 9 028
Orders received, MSEK and % of Group orders
South America 15%
14% 82% 86% 18% 2017 18% 2018 82% 2019 Q3* 4 731 6 225 5 934 2017 68% 32% 2018 2019 Q3* 70% 30% 69% 31% 8 337 9 298 8 822 64% 70% 30% 28% 2017 72% 36% 2018 2019 Q3* 4 584 5 446 5 254
Europe 23% Africa/ Middle East 13%
2018 19% 81% 17% 2017 82% 83% 18% 2019 Q3* 8 488 9 523 10 434
Asia/ Australia 26% Equipment & Service Tools & Attachments % of Group orders
Top 10 areas
% of revenues in 2018 Australia 11% USA 10% Canada 8% Russia 7% Chile 5% South Africa 5% China 5% India 4% Peru 3% Sweden 3%
27
2017 2018 2019 Q3 2019 2018 2019 2018 MSEK Full year Full year 12M Sep Q3 Q3 YTD YTD Revenues 31 364 38 285 41 127 10 158 9 651 30 569 27 727 Cost of sales
Gross profit 11 263 13 968 15 236 3 727 3 556 11 399 10 131 Gross margin, % 35.9% 36.5% 37.0% 36.7% 36.8% 37.3% 36.5% Marketing expenses
Administrative expenses
Research and development expenses
Other operating income and expenses
25
Share of profits of associates
1 Operating profit 5 930 7 385 8 282 1 927 1 898 6 120 5 223 Operating profit margin, % 18.9% 19.3% 20.1% 19.0% 19.7% 20.0% 18.8% Net financial items
Profit before tax 5 793 7 201 8 037 1 866 1 861 5 921 5 085 Proft margin, % 18.5% 18.8% 19.5% 18.4% 19.3% 19.4% 18.3% Income tax expense
Tax rate, %
Profit for the period 4 298 5 437 6 018 1 341 1 341 4 395 3 814 Items affecting comparability in operating profit
Equipment & Service Tools & Attachments
Corporate items:
Costs for split from Atlas Copco
Change in provision for share-based long-term incentive programs
20.3% 19.4% 21.3% 21.0% 21.1% 20.3%
28
2017 2018 2018 2019 2017 2018 2018 2019 MSEK
% of BS MSEK
% of BS Intangible assets 3 121 3 620 3 532 4 242 10% Share capital 21 500 500 500 1% Rental equipment 1 215 1 233 1 277 1 309 3% Retained earnings 12 020 18 297 16 859 21 282 51% Other property, plant and equipment 2 271 2 473 2 421 4 775 11% Equity attributable to owners of the parent 12 041 18 797 17 359 21 782 52% Investments in associates and joint ventures 94 208 91 209 1% Non-contolling interest 6 50 47 52 0% Financial assets and other receivables 1 101 1 119 1 199 1 135 3% Total equity 12 047 18 847 17 406 21 834 53% Deferred tax assets 425 543 526 717 2% Interest bearing liabilities 2 250 5 095 1 097 7 877 19% Total non-current assets 8 227 9 196 9 046 12 387 30% Post-employment benefits 181 283 212 640 2% Inventories 8 440 10 516 10 789 11 392 27% Other liabilities and provisions 289 412 418 399 1% Trade receivables 6 271 8 005 7 821 8 068 19% Total non-current liabilities 2 720 5 790 1 727 8 916 21% Other receivables 1 362 1 289 1 277 1 340 3% Interest bearing liabilities 4 808 1 702 5 786 750 2% Income tax receivables 287 333 576 472 1% Trade payables 3 966 4 711 4 421 3 701 9% Financial assets 1 152 944 1 029 1 052 3% Income tax liabilities 436 605 683 510 1% Cash and cash equivalents 1 808 5 872 3 949 6 814 16% Other liabilities and provisions 3 570 4 500 4 464 5 814 14% Total current assets 19 320 26 959 25 441 29 138 70% Total current liabilities 12 780 11 518 15 354 10 775 26% Total assets 27 547 36 155 34 487 41 525 100% Total equities and liabilities 27 547 36 155 34 487 41 525 100%
29
2017 2018 2019 2018 2019 MSEK Full year Full year 12M Q3 Q3 Operating cash flow Net cash flow from operating activities 5 176 4 324 6 538 920 1 852 Net cash from investing activities 5 543
62
Acquisition and divestments of subsidiaries 137 546 1 058
Other adjustments
351 410
135 Operating cash flow 4 610 3 884 6 103 777 1 883 2017 2018 2019 2018 2019 MSEK Full year Full year 12M Sep Q3 Q3 Cash flow from operating activities Operating profit 5 930 7 385 8 282 1 898 1 927 Depreciation, amortization and impairment 1 254 1 369 1 846 362 556 Capital gain/loss and other non-cash items
101
199
Net financial items received/paid
Taxes paid
Pension funding and payment of pension to employees
Change in working capital
126 Increase in rental equipment
Sale of rental equipment 422 522 663 114 213 Net cash from operating activities 5 176 4 324 6 538 920 1 852 Cash flows from investing activities Investments in other property, plant and equipment
Sale of other property, plant and equipment 70 26 45 8 18 Investments in intangible assets
Sale of intangible assets
Acquisition of subsidiaries
Divestment of subsidiaries
Proceeds to/from other financial assets, net 6 323 219 150 292 78 Net cash from investing activities 5 543
62
Cash flows from financing activities Dividends paid
Dividends paid to Atlas Copco
6
88
248 Change in interest-bearing liabilities
2 367
Net cash from financing activities
1 060
95 Net cash flow for the period 4 658 4 047 2 706
1 876 Cash and cash equivalents, beginning of the period 481 1 808 3 949 4 205 4 883 Exchange differences in cash and cash equivalents
17 159
55 Other cash flow from transactions with shareholders
1 808 5 872 6 814 3 949 6 814
30
2017 2018 2019 MSEK Full year Full year Q3 Basic earnings per share, SEK 3.55 4.50 1.11 Diluted earnings per share, SEK
1.11 Basic number of shares outstanding, millions 1 212 1 206 1 202 Diluted number of shares outstanding, millions
1 202 Equity per share, period end, SEK 9.94 15.63 18.19 Operating cash flow per share, SEK 3.80 0.30 1.57 EBITDA, MSEK 7 183 8 753 2 416 EBITDA margin, % 22.9% 22.9% 23.8% Adjusted EBIT, MSEK 6 093 7 779 2 160 Adjusted EBIT margin, % 19.4% 20.3% 21.3% Net working capital, end of period, MSEK 10 173 12 897 15 120 Average net working capital 9 991 12 158 14 124 Average net working capital/revenues, % 31.9 31.8 34.3 Average capital employed, MSEK 21 674 23 086 28 050 Return on capital employed, 12 month % 27.4 32.0 29.5 Capital employed turnover ratio 1.4 1.7 1.5 Return on equity, 12 month % 29.1 33.2 30.6 Net debt, MSEK 5 424 1 208 2 416 Net debt/EBITDA ratio 0.75 0.14 0.24 Debt/equity ratio, period end, % 45.0 6.4 11.1 Equity/assets ratio, period end, % 43.7 52.1 52.6 Number of workrelated accidents per million working hours 4.3 3.4 2.5 Sick leave, % 2.2 2.2 2.2 MWh energy from operations/Cost of sales (MSEK); 12M 8.5 7.6 7.1 Transport CO2 (tonnes)/Cost of sales (MSEK); 12M 6.2 5.6 4.7 Number of employees, period end 12 948 13 847 14 670 Additional workforce, period end 1 397 1 610 1 485