
SLIDE 1
Impact of Basel I, Basel II, and Basel III
- n Letters of Credit and Trade Finance
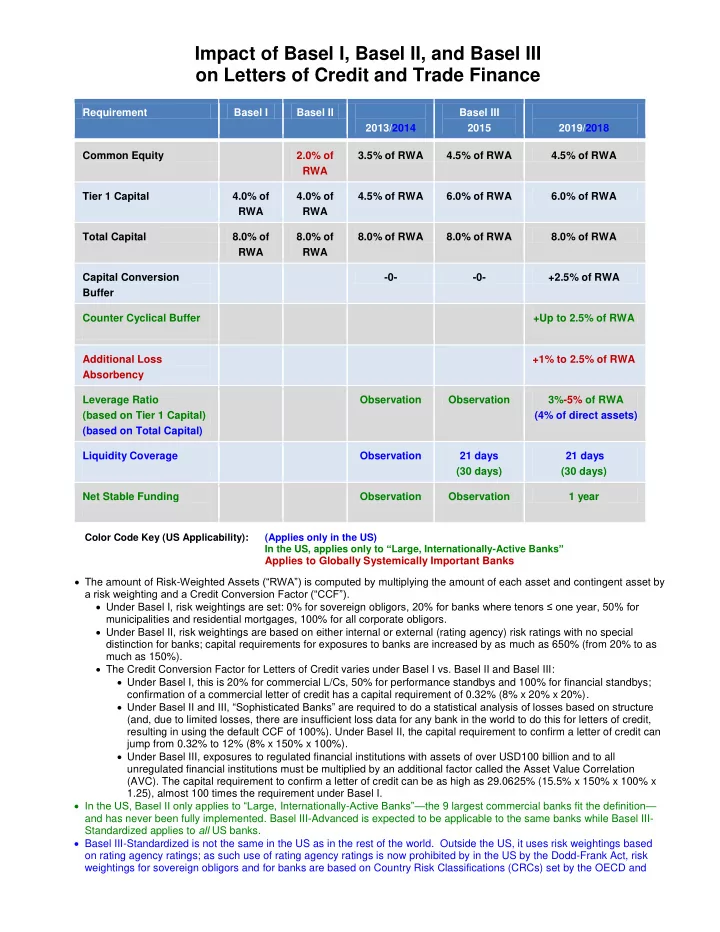
Requirement Basel I Basel II 2013/2014 Basel III 2015 2019/2018 Common Equity 2.0% of RWA 3.5% of RWA 4.5% of RWA 4.5% of RWA Tier 1 Capital 4.0% of RWA 4.0% of RWA 4.5% of RWA 6.0% of RWA 6.0% of RWA Total Capital 8.0% of RWA 8.0% of RWA 8.0% of RWA 8.0% of RWA 8.0% of RWA Capital Conversion Buffer
- 0-
- 0-
+2.5% of RWA Counter Cyclical Buffer +Up to 2.5% of RWA Additional Loss Absorbency +1% to 2.5% of RWA Leverage Ratio (based on Tier 1 Capital) (based on Total Capital) Observation Observation 3%-5% of RWA (4% of direct assets) Liquidity Coverage Observation 21 days (30 days) 21 days (30 days) Net Stable Funding Observation Observation 1 year Color Code Key (US Applicability): (Applies only in the US) In the US, applies only to “Large, Internationally-Active Banks” Applies to Globally Systemically Important Banks The amount of Risk-Weighted Assets (“RWA”) is computed by multiplying the amount of each asset and contingent asset by a risk weighting and a Credit Conversion Factor (“CCF”). Under Basel I, risk weightings are set: 0% for sovereign obligors, 20% for banks where tenors ≤ one year, 50% for municipalities and residential mortgages, 100% for all corporate obligors. Under Basel II, risk weightings are based on either internal or external (rating agency) risk ratings with no special distinction for banks; capital requirements for exposures to banks are increased by as much as 650% (from 20% to as much as 150%). The Credit Conversion Factor for Letters of Credit varies under Basel I vs. Basel II and Basel III: Under Basel I, this is 20% for commercial L/Cs, 50% for performance standbys and 100% for financial standbys; confirmation of a commercial letter of credit has a capital requirement of 0.32% (8% x 20% x 20%). Under Basel II and III, “Sophisticated Banks” are required to do a statistical analysis of losses based on structure (and, due to limited losses, there are insufficient loss data for any bank in the world to do this for letters of credit, resulting in using the default CCF of 100%). Under Basel II, the capital requirement to confirm a letter of credit can jump from 0.32% to 12% (8% x 150% x 100%). Under Basel III, exposures to regulated financial institutions with assets of over USD100 billion and to all unregulated financial institutions must be multiplied by an additional factor called the Asset Value Correlation (AVC). The capital requirement to confirm a letter of credit can be as high as 29.0625% (15.5% x 150% x 100% x 1.25), almost 100 times the requirement under Basel I. In the US, Basel II only applies to “Large, Internationally-Active Banks”—the 9 largest commercial banks fit the definition— and has never been fully implemented. Basel III-Advanced is expected to be applicable to the same banks while Basel III- Standardized applies to all US banks. Basel III-Standardized is not the same in the US as in the rest of the world. Outside the US, it uses risk weightings based
- n rating agency ratings; as such use of rating agency ratings is now prohibited by in the US by the Dodd-Frank Act, risk