
SLIDE 1
Immigration and the Demographics of the United States
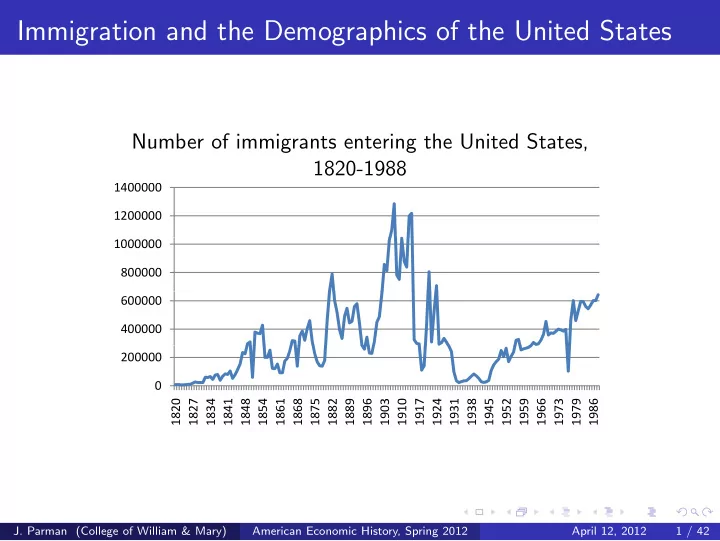
Number of immigrants entering the United States, 1820-1988
1200000 1400000 800000 1000000 400000 600000 200000 7 4 1 8 4 1 8 5 2 9 6 3 7 4 1 8 5 2 9 6 3 9 6 1820 1827 1834 1841 1848 1854 1861 1868 1875 1882 1889 1896 1903 1910 1917 1924 1931 1938 1945 1952 1959 1966 1973 1979 1986
- J. Parman (College of William & Mary)
American Economic History, Spring 2012 April 12, 2012 1 / 42