
SLIDE 1
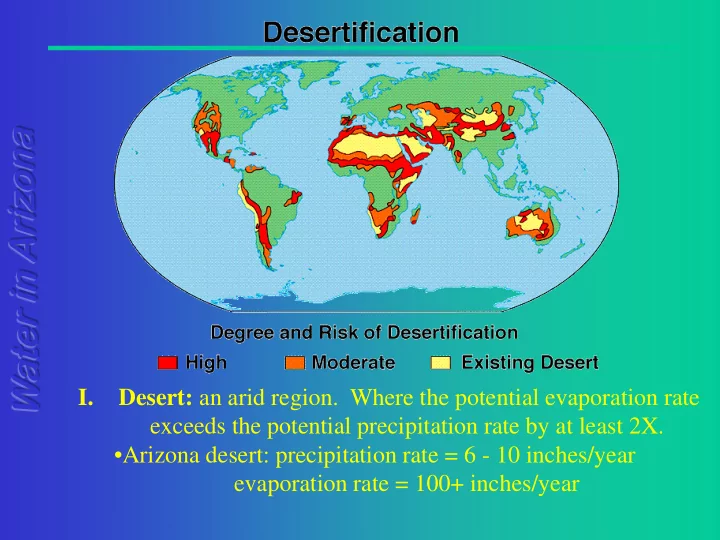
I. Desert: an arid region. Where the potential evaporation rate exceeds the potential precipitation rate by at least 2X.
- Arizona desert: precipitation rate = 6 - 10 inches/year