Hypothesis testing get data that differ from the null hypothesis. If - - PowerPoint PPT Presentation

hypothesis testing
SMART_READER_LITE
LIVE PREVIEW

Hypothesis testing get data that differ from the null hypothesis. If - - PowerPoint PPT Presentation

Hypothesis testing asks how unusual it is to Hypothesis testing get data that differ from the null hypothesis. If the data would be quite unlikely under H 0 , we reject H 0 . So we need to know how good the sample is, and how likely it is that


slide-1
SLIDE 1

Hypothesis testing

Hypothesis testing asks how unusual it is to get data that differ from the null hypothesis. If the data would be quite unlikely under H0, we reject H0.

So we imagine making an infinite number of samples, from a distribution where men and women have the same height.

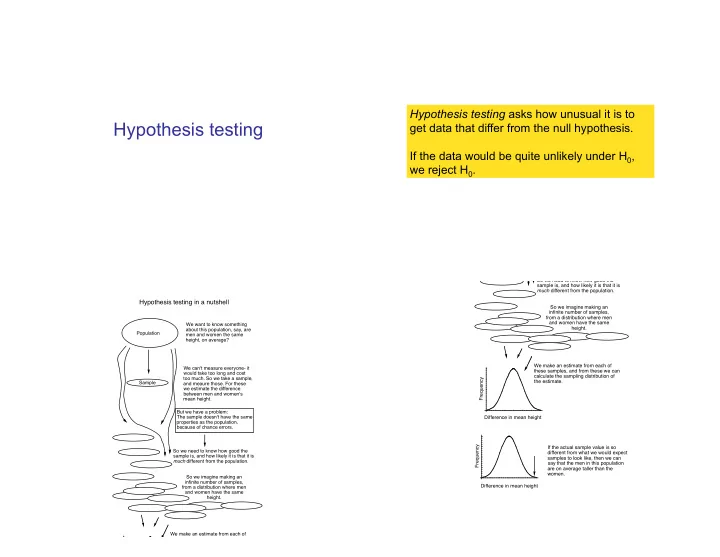
Hypothesis testing in a nutshell

Population We want to know something about this population, say, are men and women the same height, on average? We can't measure everyone- it would take too long and cost too much. So we take a sample, and meaure those. For these we estimate the difference between men and women's mean height. Sample But we have a problem: The sample doesn't have the same properties as the population, because of chance errors. So we need to know how good the sample is, and how likely it is that it is much different from the population. We make an estimate from each of So we imagine making an infinite number of samples, from a distribution where men and women have the same height. So we need to know how good the sample is, and how likely it is that it is much different from the population. We make an estimate from each of these samples, and from these we can calculate the sampling distribution of the estimate. Frequency Difference in mean height If the actual sample value is so different from what we would expect samples to look like, then we can say that the men in this population are on average taller than the women. Frequency Difference in mean height

slide-2
SLIDE 2

Hypotheses are about populations, but are tested with data from samples

Hypothesis testing usually assumes that sampling is random.

Null hypothesis: a specific statement about a population parameter made for the purposes of argument. Alternate hypothesis: represents all other possible parameter values except that stated in the null hypothesis.

The null hypothesis is usually the simplest statement, whereas the alternative hypothesis is usually the statement of greatest interest. A good null hypothesis would be interesting if proven wrong.

slide-3
SLIDE 3

A null hypothesis is specific; an alternate hypothesis is not.

A test statistic summarizes the match between the data and the null hypothesis

P-value

slide-4
SLIDE 4

A P-value is the probability of getting the data, or something as or more unusual, if the null hypothesis were true.

How to find P-values

  • Simulation
  • Parametric tests
  • Re-sampling

Hypothesis testing: an example

Does a red shirt help win wrestling?

The experiment and the results

  • Animals use red as a sign of aggression
  • Does red influence the outcome of wrestling,

taekwondo, and boxing?

– 16 of 20 rounds had more red-shirted than blue- shirted winners in these sports in the 2004 Olympics – Shirt color was randomly assigned

Hill, RA, and RA Burton 2005. Red enhances human performance in contests Nature 435:293.

slide-5
SLIDE 5

Stating the hypotheses

H0: Red- and blue-shirted athletes are equally likely to win (proportion = 0.5). HA: Red- and blue-shirted athletes are not equally likely to win (proportion 0.5).

Estimating the value

  • 16 of 20 is a proportion of proportion =

0.8

  • This is a discrepancy of 0.3 from the

proportion proposed by the null hypothesis, proportion = 0.5

Is this discrepancy by chance alone?: Estimating the probability of such an extreme result

  • The null distribution for a test statistic is

the probability distribution of alternative

  • utcomes when a random sample is

taken from a population corresponding to the null expectation.

The null distribution of the sample proportion

slide-6
SLIDE 6

Calculating the P-value from the null distribution

The P-value is calculated as P = 2 [Pr(16) + Pr(17) + Pr(18) + Pr(19) + Pr(20)] = 0.012.

Statistical significance

The significance level, , is a probability used as a criterion for rejecting the null hypothesis. If the P-value for a test is less than or equal to , then the null hypothesis is rejected.

is often 0.05 Significance for the red shirt example

  • P = 0.012
  • P < , so we can reject the null

hypothesis

  • Athletes in red shirts were more likely to

win.

slide-7
SLIDE 7

Larger samples give more information

  • A larger sample will tend to give and

estimate with a smaller confidence interval

  • A larger sample will give more power to

reject a false null hypothesis

Hypothesis testing: another example

Do dogs resemble their owners?

Common wisdom holds that dogs resemble their owners. Is this true?

  • 41 dog owners approached in parks;

photos taken of dog and owner separately

  • Photo of owner and dog, along with

another photo of dog, shown to students to match

Roy, M.M., & Christenfeld, N.J.S. (2004). Do dogs resemble their owners? Psychological Science, 15, 361–363

Hypotheses

H0: The proportion of correct matches is proportion = 0.5. HA: The proportion of correct matches is different from proportion = 0.5.

slide-8
SLIDE 8

Data

Of 41 matches, 23 were correct and 18 were incorrect.

Estimating the proportion

sample proportion = 23 41 = 0.56

Null distribution for dog/owner resemblance

P = 0.53.

The P-value:

We do not reject the null hypothesis that dogs do not resemble their owners.

slide-9
SLIDE 9

Jargon Significance level

  • The acceptable probability of rejecting a

true null hypothesis

  • Called
  • For many purposes, = 0.05 is

acceptable

Type I error

  • Rejecting a true null hypothesis
  • Probability of Type I error is (the

significance level)

Type II error

  • Not rejecting a false null hypothesis
  • The probability of a Type II error is .
  • The smaller , the more power a test

has.

slide-10
SLIDE 10

Power

  • The ability of a test to reject a false null

hypothesis

  • Power = 1-

One- and two-tailed tests

  • Most tests are two-tailed tests.
  • This means that a deviation in either

direction would reject the null hypothesis.

  • Normally is divided into /2 on one

side and /2 on the other.

Test statistic 2.5% 2.5%

slide-11
SLIDE 11

One-tailed tests

  • Only used when the other tail is

nonsensical

  • For example, comparing grades on a

multiple choice test to that expected by random guessing

Test Statistic

  • A number calculated to represent the

match between a set of data and the null hypothesis

  • Can be compared to a general

distribution to infer probability

Critical value

  • The value of a test statistic beyond

which the null hypothesis can be rejected

“Statistically significant”

  • P <
  • We can “reject the null hypothesis”
slide-12
SLIDE 12

We never “accept the null hypothesis” Correlation does not automatically imply causation Correlation does not automatically imply causation

48

Life expectancy by country:

slide-13
SLIDE 13

Confounding variable

An unmeasured variable that may be cause both X and Y

  • Observations vs. Experiments

Statistical significance Biological importance

slide-14
SLIDE 14

Important Unimportant Significant

Polio vaccine reduces incidence of polio Things you don’t care about, or already well known things:

Insignificant

Small study shows a possible effect, leading to larger study which finds significance.

  • r

Large study showing no effect of drug that was thought to be beneficial. Studies with small sample size and high P-value

  • r

Things you don’t care about