How Simulations and Databases Play Nicely Alex Szalay, JHU Gerard - - PowerPoint PPT Presentation

how simulations and databases play nicely
SMART_READER_LITE
LIVE PREVIEW

How Simulations and Databases Play Nicely Alex Szalay, JHU Gerard - - PowerPoint PPT Presentation

How Simulations and Databases Play Nicely Alex Szalay, JHU Gerard Lemson, MPA Thursday, December 16, 2010 An Exponential World Scientific data doubles every year caused by successive generations of inexpensive sensors +


slide-1
SLIDE 1

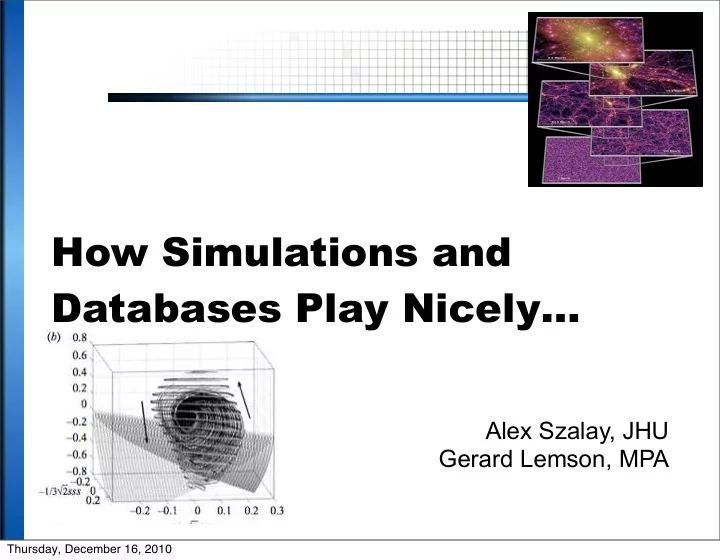
How Simulations and Databases Play Nicely…

Alex Szalay, JHU Gerard Lemson, MPA

Thursday, December 16, 2010

slide-2
SLIDE 2
  • Scientific data doubles every year

– caused by successive generations

  • f inexpensive sensors +

exponentially faster computing

  • Changes the nature of scientific computing
  • Cuts across disciplines (eScience)
  • It becomes increasingly harder to extract knowledge
  • 20% of the world’s servers go into centers by the “Big 5”

– Google, Microsoft, Yahoo, Amazon, eBay

  • So it is not only the scientific data!

An Exponential World

CCDs Glass

Thursday, December 16, 2010

slide-3
SLIDE 3
  • Scientific data doubles every year

– caused by successive generations

  • f inexpensive sensors +

exponentially faster computing

  • Changes the nature of scientific computing
  • Cuts across disciplines (eScience)
  • It becomes increasingly harder to extract knowledge
  • 20% of the world’s servers go into centers by the “Big 5”

– Google, Microsoft, Yahoo, Amazon, eBay

  • So it is not only the scientific data!

An Exponential World

CCDs Glass

Thursday, December 16, 2010

slide-4
SLIDE 4
  • Scientific data doubles every year

– caused by successive generations

  • f inexpensive sensors +

exponentially faster computing

  • Changes the nature of scientific computing
  • Cuts across disciplines (eScience)
  • It becomes increasingly harder to extract knowledge
  • 20% of the world’s servers go into centers by the “Big 5”

– Google, Microsoft, Yahoo, Amazon, eBay

  • So it is not only the scientific data!

An Exponential World

200.0000 400.0000 600.0000 800.0000 1970 1975 1980 1985 1990 1995 2000 CCDs Glass

Thursday, December 16, 2010

slide-5
SLIDE 5
  • Scientific data doubles every year

– caused by successive generations

  • f inexpensive sensors +

exponentially faster computing

  • Changes the nature of scientific computing
  • Cuts across disciplines (eScience)
  • It becomes increasingly harder to extract knowledge
  • 20% of the world’s servers go into centers by the “Big 5”

– Google, Microsoft, Yahoo, Amazon, eBay

  • So it is not only the scientific data!

An Exponential World

200.0000 400.0000 600.0000 800.0000 1970 1975 1980 1985 1990 1995 2000 CCDs Glass

Thursday, December 16, 2010

slide-6
SLIDE 6

Data Access is Hitting a Wall

On a typical University desktop

  • You can GREP/FTP 1 MB in a second
  • You can GREP/FTP 1 GB in a minute
  • You can GREP/FTP 1 TB in 2 days
  • You can GREP/FTP 1 PB in 3 years

and 1PB ~500 - 1,000 disks

  • At some point you need

indices to limit search parallel data search and analysis

  • This is where databases can help
  • Remote analysis avoids moving data

FTP and GREP are not adequate

Thursday, December 16, 2010

slide-7
SLIDE 7

Scientific Data Analysis Today

  • Scientific data is doubling every year, reaching PBs
  • Architectures increasingly CPU-heavy, IO-poor
  • Need to do data analysis off-line
  • Most scientific data analysis done on small to midsize

BeoWulf clusters, from faculty startup

  • Data-intensive scalable architectures needed
  • Scientists are hitting the “data wall” at around 100TB
  • Universities hitting the “power wall”

Thursday, December 16, 2010

slide-8
SLIDE 8

Continuing Growth

How long does the data growth continue?

  • High end always linear
  • Exponential comes from technology + economics

– rapidly changing generations – like CCD’s replacing plates, and become ever cheaper

  • How many generations of instruments are left?
  • Are there new growth areas emerging?
  • Software is becoming a new kind of instrument

– Value added federated data sets – Large and complex simulations – Hierarchical data replication

Thursday, December 16, 2010

slide-9
SLIDE 9

Cosmological Simulations

State of the art simulations have ~1010 particles and produce over 30TB of data (Millennium)

  • Build up dark matter halos
  • Track merging history of halos
  • Use it to assign star formation history
  • Combination with spectral synthesis
  • Realistic distribution of galaxy types
  • Hard to analyze the data afterwards -> need DB
  • What is the best way to compare to real data?
  • Next generation of simulations with 1012 particles

and 500TB of output are under way (Exascale-Sky)

Thursday, December 16, 2010

slide-10
SLIDE 10

“Moore’s law” for N-body simulations

Courtesy Simon White Thursday, December 16, 2010

slide-11
SLIDE 11

Analysis and Databases

  • Much statistical analysis deals with

– Creating uniform samples – – data filtering – Assembling relevant subsets – Estimating completeness – censoring bad data – Counting and building histograms – Generating Monte-Carlo subsets – Likelihood calculations – Hypothesis testing

  • Traditionally these are performed on files
  • Most of these tasks are much better done inside a

database

Thursday, December 16, 2010

slide-12
SLIDE 12

Motivations for a relational database

  • Encapsulation of data in terms of logical structure, no

need to know about internals of data storage

  • Standard query language for finding information
  • Advanced query optimizers (indexes, clustering)
  • Transparent internal parallelization
  • Authenticated remote access for multiple users at

same time

  • Forces one to think carefully about data structure
  • Speeds up path from science question to answer
  • Facilitates communication (query code is cleaner)
  • Facilitates adaptation to IVOA standards (ADQL)

Thursday, December 16, 2010

slide-13
SLIDE 13

Millennium Simulation

  • Virgo consortium

– Gadget 3 – 10 billion particles, dark matter only – 500 Mpc periodic box – Concordance model (as of 2004) initial conditions – 64 snapshots – 350000 CPU hours – O(30Tb) raw + post-processed data

  • Post-processing data complex and large
  • Challenge to analyze, even locally!

Thursday, December 16, 2010

slide-14
SLIDE 14

So what do we want to store?

  • Density field on 2563 mesh

– CIC – Gaussian smoothed: 1.25,2.5,5,10 Mpc/h

  • Friends-of-Friends (FOF) groups
  • SUBFIND Subhalos
  • Galaxies from 2 semi-analytical models (SAMs)

– MPA (L-Galaxies, DeLucia & Blaizot, 2006) – Durham (GalForm, Bower et al, 2006)

  • Subhalo and galaxy formation histories: merger trees
  • Mock catalogues on light-cone

– Pencil beams (Kitzbichler & White, 2006) – All-sky (depth of SDSS spectral sample) (Blaizot et al, 2005)

Thursday, December 16, 2010

slide-15
SLIDE 15

12

Thursday, December 16, 2010

slide-16
SLIDE 16

FOF groups, (sub)halos and galaxies

Thursday, December 16, 2010

slide-17
SLIDE 17

Time evolution: merger trees

14

Thursday, December 16, 2010

slide-18
SLIDE 18

Mock Catalogues

Thursday, December 16, 2010

slide-19
SLIDE 19

Designing the Database

  • Need a model for data, including relations
  • Model needs to support science:“20 questions”

1. Return the galaxies residing in halos of mass between 10^13 and 10^14 solar masses. 2. Return the galaxy content at z=3 of the progenitors of a halo identified at z=0 3. Return the complete halo merger tree for a halo identified at z=0 4. Find all the z=3 progenitors of z=0 red ellipticals (i.e. B-V>0.8 B/T > 0.5) 5. Find the descendents at z=1 of all LBG's (i.e. galaxies with SFR>10 Msun/yr) at z=3 6. Find all the z=2 galaxies which were within 1Mpc of a LBG (i.e. SFR>10Msun/yr) at some previous redshift. 7. Find the multiplicity function of halos depending on their environment (overdensity of density field smoothed on certain scale) 8. Find the dependency of halo properties on environment

Thursday, December 16, 2010

slide-20
SLIDE 20

Formation histories: merger trees

  • Tree structure

– halos have single descendant – halos have main progenitor

  • Hierarchical structures usually handled using

recursive code

– inefficient for data access – not (well) supported in RDBs

  • Tree indexes

– depth first ordering of nodes defines identifier – pointer to last progenitor in subtree

Thursday, December 16, 2010

slide-21
SLIDE 21

18

Merger trees : select prog.* from galaxies d , galaxies p where d.galaxyId = @id and p.galaxyId between d.galaxyId and d.lastProgenitorId Branching points : select descendantId from galaxies d where descendantId != -1 group by descendantId having count(*) > 1

Thursday, December 16, 2010

slide-22
SLIDE 22

Spatial queries, random samples

  • Spatial queries require multi-dimensional indexes.
  • (x,y,z) does not work: need discretisation

– index on (ix,iy,iz) withix=floor(x/10) etc

  • More sophisticated: space fillilng curves

– bit-interleaving/octtree/Z-Index – Peano-Hilbert curve – Need custom functions for range queries – Plug in modular space filling library (Budavari)

  • Random sampling using a RANDOM column

– RANDOM from [0,1000000]

Thursday, December 16, 2010

slide-23
SLIDE 23

Merger Tree for Halo with ID

select p.snapnum , p.x,p.y,p.z, , p.np,p.redshift from mpahalo d , mpahalo p where d.haloid=0 and p.haloid between d.haloid and d.lastprogenitorid

Thursday, December 16, 2010

slide-24
SLIDE 24

21

Thursday, December 16, 2010

slide-25
SLIDE 25

Immersive Turbulence

  • Understand the nature of turbulence

– Consecutive snapshots of a 1,0243 simulation of turbulence: now 30 Terabytes – Treat it as an experiment, observe the database! – Throw test particles (sensors) in from your laptop, immerse into the simulation, like in the movie Twister

  • New paradigm for analyzing

HPC simulations!

with C. Meneveau, S. Chen (ME), G. Eyink (AM), E. Perlman, R. Burns (CS)

Thursday, December 16, 2010

slide-26
SLIDE 26

The Milky Way Laboratory

  • Idea: use cosmology simulations as an immersive

laboratory for general users

  • Use Via Lactea-II (20TB) as prototype, then Silver

River (500TB+) as production (15M CPU hours)

  • Output 10K+ hi-rez snapshots (200x of previous)
  • Users insert test particles (dwarf galaxies) into

system and follow trajectories in pre-computed simulation

  • Users interact remotely with

0.5PB in ‘real time’

  • Madau, Rockosi, Wyse,

Szalay, Westermann

Thursday, December 16, 2010

slide-27
SLIDE 27

Visualizing Large Simulations

  • Needs to be done where the data is
  • Interactive visualizations driven remotely
  • It is easier to send a HD 3D video stream to the user

than all the data

  • Visualizations are already becoming IO limited
  • It is possible to build individual servers with extreme

data rates (5GBps per server…)

Thursday, December 16, 2010

slide-28
SLIDE 28

Real Time Interactions with TB

  • Aquarius simulation (V.Springel, Heidelberg)
  • 150M particles, 128 timesteps
  • 20B total points, 1.4TB total
  • Real-time, interactive on a single GeForce 9800
  • Hierarchical merging of particles over an octree
  • Trajectories computed from 3 subsequent snapshots
  • Tag particles of interest interactively
  • Limiting factor: disk streaming speed
  • Done by an undergraduate over two months (Tamas

Szalay) with Volker Springel and G. Lemson http://arxiv.org/abs/0811.2055

Thursday, December 16, 2010

slide-29
SLIDE 29

Thursday, December 16, 2010

slide-30
SLIDE 30

Summary

Thursday, December 16, 2010

slide-31
SLIDE 31

Summary

  • Simulations soon approaching Petabytes

Thursday, December 16, 2010

slide-32
SLIDE 32

Summary

  • Simulations soon approaching Petabytes
  • Analysis while simulation is running restricts user base

Thursday, December 16, 2010

slide-33
SLIDE 33

Summary

  • Simulations soon approaching Petabytes
  • Analysis while simulation is running restricts user base
  • Need to be able to “publish” simulations

Thursday, December 16, 2010

slide-34
SLIDE 34

Summary

  • Simulations soon approaching Petabytes
  • Analysis while simulation is running restricts user base
  • Need to be able to “publish” simulations
  • Analysis requires a different environment

– Analyze where the data is

Thursday, December 16, 2010

slide-35
SLIDE 35

Summary

  • Simulations soon approaching Petabytes
  • Analysis while simulation is running restricts user base
  • Need to be able to “publish” simulations
  • Analysis requires a different environment

– Analyze where the data is

  • Databases provide many of the tools required

– Parallelism, indexing, fast I/O

Thursday, December 16, 2010

slide-36
SLIDE 36

Summary

  • Simulations soon approaching Petabytes
  • Analysis while simulation is running restricts user base
  • Need to be able to “publish” simulations
  • Analysis requires a different environment

– Analyze where the data is

  • Databases provide many of the tools required

– Parallelism, indexing, fast I/O

  • But we need smart databases

– Analysis tools integrated with DB kernel – Array data type for efficient storage model – Visualization integrated

Thursday, December 16, 2010

slide-37
SLIDE 37

Summary

  • Simulations soon approaching Petabytes
  • Analysis while simulation is running restricts user base
  • Need to be able to “publish” simulations
  • Analysis requires a different environment

– Analyze where the data is

  • Databases provide many of the tools required

– Parallelism, indexing, fast I/O

  • But we need smart databases

– Analysis tools integrated with DB kernel – Array data type for efficient storage model – Visualization integrated

  • Petabytes require novel access methods

– Immersive simulations and remote visualizations

Thursday, December 16, 2010