HOW LONG DOES IT TAKE TO THE FIRST Major cause of deaths Road - - PDF document

how long does it take to the first
SMART_READER_LITE
LIVE PREVIEW

HOW LONG DOES IT TAKE TO THE FIRST Major cause of deaths Road - - PDF document

2425 th October 2019 HOW LONG DOES IT TAKE TO THE FIRST DROWSINESS STATE: AN EXPLORATORY ANALYSIS Vision zero for traffic fatalities and serious injuriesresearch questions and challenges Warsaw, Poland 1. BACKGROUND: DROWSINESS IMPACTS ON


slide-1
SLIDE 1

HOW LONG DOES IT TAKE TO THE FIRST DROWSINESS STATE: AN EXPLORATORY ANALYSIS

Sónia Soares ▪ António Lobo ▪ Pedro Ferreira ▪ Sara Ferreira ▪ Carlos Campos Miguel Leitão ▪ Nuno Gregório ▪ Ana Bastos ▪ António Couto

24–25th October 2019 Warsaw, Poland Vision zero for traffic fatalities and serious injuries—research questions and challenges HOW LONG DOES IT TAKE TO THE FIRST DROWSINESS STATE: AN EXPLORATORY ANALYSIS

  • 1. BACKGROUND: DROWSINESS IMPACTS ON ROAD SAFETY

Road crashes

  • Major cause of deaths
  • Strong physical injuries
  • Significant economic impact

DROWSINESS accounts for 20% of all fatal and severe crashes (Kecklund, Anund et al. 2011) and resulted in approximately 72.000 crashes, 44.000 injuries, and 800 deaths in the USA in 2013 (National Highway Traffic Safety Administration, n.d.). Drowsiness analysis, detection and prediction PREVENT CRASH RISK HOW LONG DOES IT TAKE TO THE FIRST DROWSINESS STATE: AN EXPLORATORY ANALYSIS

  • 1. BACKGROUND: DROWSINESS EVALUATION

1. Factors with influence on drowsiness Time-on-task, sleep deprivation, lighting conditions, environment, road geometry... 2. Drowsiness measures Biometric (physiological/neurophysiological) and subjective (self-assessment) 3. Driving performance Trajectory, compliance with traffic rules... HOW LONG DOES IT TAKE TO THE FIRST DROWSINESS STATE: AN EXPLORATORY ANALYSIS

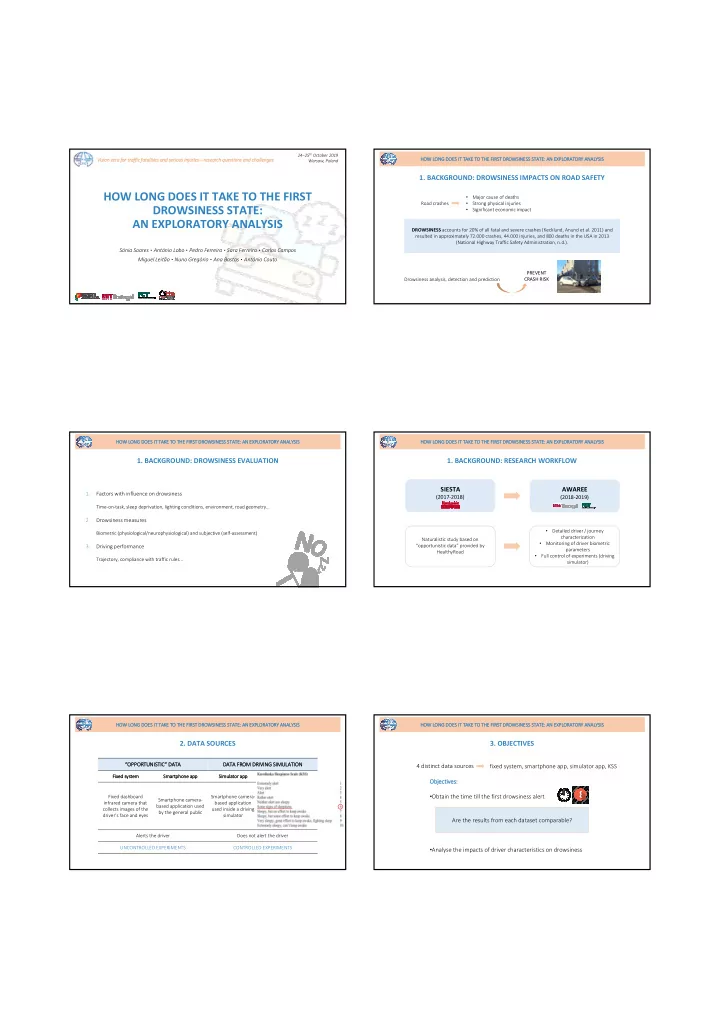
  • 1. BACKGROUND: RESEARCH WORKFLOW

SIESTA

(2017-2018)

AWAREE

(2018-2019) Naturalistic study based on “opportunistic data” provided by HealthyRoad

  • Detailed driver / journey

characterization

  • Monitoring of driver biometric

parameters

  • Full control of experiments (driving

simulator) HOW LONG DOES IT TAKE TO THE FIRST DROWSINESS STATE: AN EXPLORATORY ANALYSIS

  • 2. DATA SOURCES

“OPPORTUNISTIC” DATA DATA FROM DRIVING SIMULATION Fixed system Smartphone app Simulator app KSS Fixed dashboard infrared camera that collects images of the driver’s face and eyes Smartphone camera- based application used by the general public Smartphone camera- based application used inside a driving simulator Self-assessment of drowsiness levels in 15- min intervals during driving simulation Alerts the driver Does not alert the driver UNCONTROLLED EXPERIMENTS CONTROLLED EXPERIMENTS Objectives:

  • Obtain the time till the first drowsiness alert
  • Analyse the impacts of driver characteristics on drowsiness

Are the results from each dataset comparable?

HOW LONG DOES IT TAKE TO THE FIRST DROWSINESS STATE: AN EXPLORATORY ANALYSIS

4 distinct data sources

  • 3. OBJECTIVES

fixed system, smartphone app, simulator app, KSS

slide-2
SLIDE 2

HOW LONG DOES IT TAKE TO THE FIRST DROWSINESS STATE: AN EXPLORATORY ANALYSIS

  • 4. EXPERIMENTAL PROCEDURES: SIMULATION SETTING

Start of the driving g session 14h00 Driving g duration 75 min Scenario Monotonous environment – rural freeway Conditions Compliance with traffic rules No outside distractions (e.g. conversation, music, phone usage, etc.) Drowsiness imposed by the scenario conditions and time of the journey DriS – CITTA/ FEUP HOW LONG DOES IT TAKE TO THE FIRST DROWSINESS STATE: AN EXPLORATORY ANALYSIS

  • 4. EXPERIMENTAL PROCEDURES: DRIVER MONITORING STRATEGIES

Biometric measures Driver variables Dynamic driving variables

  • Eye-tracking system FOVIO
  • Smartwatch
  • Steering wheel cover Bitalino
  • HealthyRoad infrared and RGB

cameras

  • DriveSafely app
  • Age
  • Gender
  • Height/weight
  • Occupation
  • Hours slept in the previous night
  • Smoke habits
  • Health history
  • Habits of physical activity
  • Driving information
  • KSS (subjective)

Obtained by DriS:

  • Speed
  • Acceleration
  • Deceleration
  • Trajectory

Every 15 min An attention sign appears in the vehicle dashboard The participants rate their drowsiness level HOW LONG DOES IT TAKE TO THE FIRST DROWSINESS STATE: AN EXPLORATORY ANALYSIS

  • 5. FIRST STAGE: F-TEST 2X2 DATA SOURCES

F Value Fixed system Smartphone app Simulator app KSS Fixed system

  • Smartphone app

1.262

  • Simulator app

1.154 1.093

  • KSS

1.137 1.109 1.014

  • P(F≤f)

Fixed system Smartphone app Simulator app KSS Fixed system

  • Smartphone app

0.070

  • Simulator app

0.305 0.449

  • KSS

0.251 0.351 0.457

  • F Critical Value

Fixed system Smartphone app Simulator app KSS Fixed system

  • Smartphone app

1.295

  • Simulator app

1.688 2.132

  • KSS

1.382 1.542 1.876

  • Comparing the

distributions of the time to the first alert HOW LONG DOES IT TAKE TO THE FIRST DROWSINESS STATE: AN EXPLORATORY ANALYSIS

  • 5. FIRST STAGE: DESCRIPTIVE STATISTICS

Fixed system Smartphone app Simulator app KSS Total valid data 456.00 88.00 16.00 50.00 Number of participants without alerts 122.00 36.00 3.00 8.00 Mean time till the first alert (min) 23.99 22.94 25.48 34.62 Standard deviation (min) 25.42 28.42 26.47 26.87 25th percentile (min) 4.73 3.06 2.60 8.63 75th percentile (min) 36.19 33.68 32.67 58.13 HOW LONG DOES IT TAKE TO THE FIRST DROWSINESS STATE: AN EXPLORATORY ANALYSIS

  • 6. SECOND STAGE: BINARY PROBIT MODEL

Independent variables Dependent variable

  • Age
  • age

KSS

  • KSS < 6 → Not Drowsy
  • KSS ≥ 6 → Drowsy
  • Gender
  • gender
  • Body Mass Index
  • bmi
  • Hours slept in the previous night
  • hours_slept
  • Stress situation in the previous 24 hours
  • stress
  • Smoke habits
  • smoke
  • Medication taken in the previous 24 hours
  • did not take
  • depression/anxiety/muscle relaxant
  • ther
  • Time when the participant rates his/her

drowsiness level

  • 15min
  • 30min
  • 45min
  • 60min
  • 75min

HOW LONG DOES IT TAKE TO THE FIRST DROWSINESS STATE: AN EXPLORATORY ANALYSIS

  • 6. SECOND STAGE: RESULTS

Coefficient Standard Error

  • Prob. |z|>Z*

constant 4.44009*** .99381 .0000 age

  • .01837***

.00666 .0058 ge gender

  • .46041**

.19900 .0207 bmi

  • .05944***

.02090 .0045 hours_slept

  • .32331***

.09256 .0005 stress .65585** .33006 .0469 smoke

  • 1.14862***

.43883 .0089 medication_other

  • .73959

.45357 .1030 medication_did_not_take

  • .82392*

.42891 .0547 15min .21862 .29863 .4641 30min .82759*** .29705 .0053 45min 1.53176*** .30291 .0000 60min 1.59125*** .30501 .0000 75min 1.54296*** .30442 .0000 Note: ***, **, * ==> Significance at 1%, 5%, 10% level.

slide-3
SLIDE 3

HOW LONG DOES IT TAKE TO THE FIRST DROWSINESS STATE: AN EXPLORATORY ANALYSIS

  • 6. SECOND STAGE: DISCUSSION

HOW LONG DOES IT TAKE TO THE FIRST DROWSINESS STATE: AN EXPLORATORY ANALYSIS

  • 7. CONCLUSIONS AND FUTURE WORK
  • Need to confirm similarities with a larger simulated dataset (experiments are still running)
  • Evaluate the influence of biometric and dynamic driving parameters

How long does it take to the first drowsiness state? According to naturalistic data ≈ 23 minutes According to data from driving simulation ≈ 30 minutes

HOW LONG DOES IT TAKE TO THE FIRST DROWSINESS STATE: AN EXPLORATORY ANALYSIS

THANK YOU FOR YOUR ATTENTION!

This work is financially supported by national funds through the FCT/MCTES (PIDDAC), under the MIT Portugal Programme under the project AWAREE (MIT-EXPL/STS/0125/2017).