
SLIDE 1
1
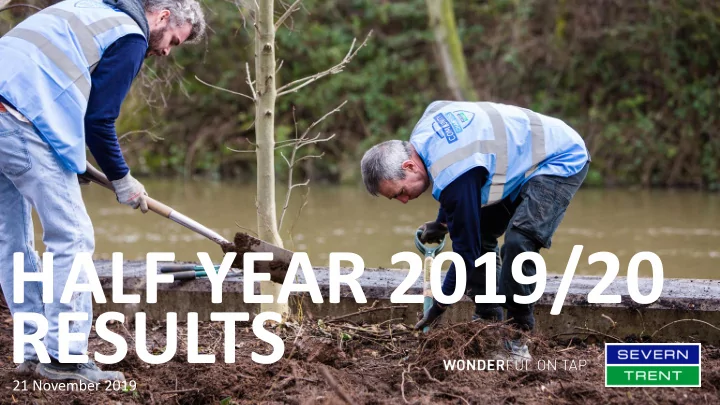
21 November 2019
HALF YEAR 2019/20 RESULTS 1 21 November 2019 DISCLAIMERS - - PowerPoint PPT Presentation
HALF YEAR 2019/20 RESULTS 1 21 November 2019 DISCLAIMERS Cautionary statement regarding forward-looking statements This document contains statements that are, or may be deemed to be, forward - looking statements with respect to Severn
1
21 November 2019
2
Cautionary statement regarding forward-looking statements
This document contains statements that are, or may be deemed to be, ‘forward-looking statements’ with respect to Severn Trent’s financial condition, results of operations and business and certain of Severn Trent’s plans and objectives with respect to these items. Forward-looking statements are sometimes, but not always, identified by their use of a date in the future or such words as ‘anticipates’, ‘aims’, ‘due’, ‘could’, ‘may’, 'will', 'would', ‘should’, ‘expects’, ‘believes’, ‘intends’, ‘plans’, 'projects', ‘potential’, ‘reasonably possible’, ‘targets’, ‘goal’, ‘estimates’ or words with a similar meaning, and, in each case, their negative or other variations or comparable terminology. Any forward-looking statements in this document are based on Severn Trent's current expectations and, by their very nature, forward-looking statements are inherently unpredictable, speculative and involve risk and uncertainty because they relate to events and depend on circumstances that may or may not occur in the future. Forward-looking statements are not guarantees of future performance and no assurances can be given that the forward-looking statements in this document will be realised. There are a number of factors, many of which are beyond Severn Trent's control, that could cause actual results, performance and developments to differ materially from those expressed or implied by these forward-looking statements. These factors include, but are not limited to: the Principal Risks disclosed in our latest Annual Report and Accounts (which have not been updated since the date of its publication); changes in the economies and markets in which the Group operates; changes in the regulatory and competition frameworks in which the Group operates; the impact of legal or other proceedings against or which affect the Group; and changes in interest and exchange rates. All written or verbal forward-looking statements, made in this document or made subsequently, which are attributable to Severn Trent or any other member of the Group or persons acting on their behalf are expressly qualified in their entirety by the factors referred to above. No assurances can be given that the forward-looking statements in this document will be realised. This document speaks as at the date of publication. Save as required by applicable laws and regulations, Severn Trent does not intend to update any forward-looking statements and does not undertake any obligation to do so. Past performance of securities of Severn Trent Plc cannot be relied upon as a guide to the future performance of securities of Severn Trent Plc. Nothing in this document should be regarded as a profit forecast. This document is not an offer to sell, exchange or transfer any securities of Severn Trent Plc or any of its subsidiaries and is not soliciting an offer to purchase, exchange or transfer such securities in any jurisdiction. Securities may not be offered, sold or transferred in the United States, absent registration or an applicable exemption from the registration requirements of the US Securities Act of 1933 (as amended).DISCLAIMERS
3
Chief Executive
LIV GARFIELD
4
HIGHLIGHTS
Performance supports at least £25m of customer ODIs this year
Finishing AMP6 in a strong position on key measures and capital schemes… …while putting long term sustainability at the heart of our operations and financing Balanced performance with consistent improvement in Water
Continued leadership
1,600km of river Invested £374m in H1 with Birmingham Resilience on track
Leakage
for 8th time in 9 years
Supply interruptions
40% improvement year-on-year
WQ complaints
25% reduction
5
JAMES BOWLING
Chief Financial Officer
6
H1 2019/20 FINANCIAL HIGHLIGHTS
Accredited with the Fair Tax Mark and launching a Sustainable Finance Framework to support the long term sustainability of our business Group PBIT1 of £286m – laying the foundations for AMP7 with a good set of results
Strong cost control Interim dividend 40.03p Improved pension deficit £391m Effective interest rate 3.7%
H1 operating costs in line with expectations; 9% real term reduction in STW operating costs in AMP6 170 bps reduction in effective rate in AMP6, strong position entering AMP7 Supported by effective hedging strategy, strong asset performance and sustainable contributions In line with dividend policy 1. Underlying Profit before Interest and Tax (PBIT). 7
REGULATED WATER AND WASTE WATER
1. £177 million is quoted pre-tax in nominal prices, assuming customer ODIs are spread evenly across AMP7. The equivalent in 2012/13 prices is £132m. Figure includes FY19/20 guidance of at least £25 million (pre-tax, 2012/13 prices). 2. WRFIM = Wholesale Revenue Forecasting Incentive Mechanism, which trues up billing over the five year Final Determination.Revenue of £808m up 1.6%, as FY18 customer ODI rewards are deferred into AMP7
795.0 24.1 (10.8) 4.0 (4.8) 807.5 H1 2018/19 RPI + K Customer ODIs WRFIM2 Other H1 2019/20£m
Lower net reward taken in 19/20 revenue following decision to defer £177m of AMP6 reward to AMP71 WRFIM2 8
268.4 12.5 2.2 (2.2) (0.1) (5.2) (10.7) (4.8) 260.1 H1 2018/19 Turnover Net labour and hired and contracted costs Power Other costs Bad debt Infrastructure renewals expenditure Depreciation H1 2019/20REGULATED WATER AND WASTE WATER
£m
Underlying PBIT1 of £260m, with net tariff increases offset by infrastructure renewals
Good cost control, absorbing above inflation annual pay award of 3% Ongoing challenges with older debt collection, improvement plan underway for H2 Completing AMP6 programme, as planned Anticipated pass-through cost increase 9
£18.9m £23.7m £18.4m £6.2m
H1 18/19 H1 19/20 Operational PBIT Property PBITBUSINESS SERVICES
Efficiency across key contracts increasing profit margin from 7% to over 13% this year Successful integration of Agrivert contributed to generationTurnover £112m
+16%PBIT1 £29.9m
PBIT1
(excl. property)£23.7m
+25% £6m of sales in H1, now£37.3m £29.9m
1. Underlying Profit before Interest and Tax (PBIT). 2. 100% renewable energy, 100% electric vehicles (assumes suitable specialist vehicles such as tankers become available), net zero carbon emissions. 10 10
5.4% 4.5% 4.4% 4.5% 3.9% 3.7% 4.5%
14/15 15/16 16/17 17/18 18/19 H1 19/20 Effective interest rate PR19 draft embedded debt rateFINANCING PERFORMANCE
170 bps
£68.2m £71.4m £6.9m £5.4m £18.0m £17.0m H1 18/19 H1 19/20£93.1m £93.8m
Cash interest2 Net pension finance cost RPI rolled up Reduction in effective interest rate1 in AMP6 1. Before net pension finance costs but including capitalised interest. 2. Net of capitalised interest. Net finance costs up marginally as impact of higher average debt is offset by lower effective interest rate£93.8m
11 11
A SUSTAINABLE FINANCING STRATEGY
15%60% 25% Floating Fixed Index-Linked
Gross Debt - £6,168m
Linking our financing to delivery of our sustainable commitments
De-risked and diversified portfolio… …through an agile treasury strategy
Clear AMP7 strategy defined, with £3bn of debt to raise Committed Facilities Sustainable Bonds Private Placements Leases
Flexible framework can incorporate: Business case proposal Assessment of eligibility for sustainable portfolio Formal assessment by the Sustainable Finance Committee External assurance and reportingGearing1 of 61.1% CPI now 31% of index-linked debt at £475m
1. Severn Trent Water Group (Severn Trent Water and Hafren Dyfrdwy combined) Net Debt/Regulatory Capital Value. 12 12
£410m £501m £591m £769m £700m - £800m 15/16 16/17 17/18 18/19 19/20 GuidanceCash from operations £497m
up 1.5%GROUP CASH FLOW
Capital expenditure £374m
up 10%Net Debt1 £5,957m Interest, dividends & tax paid £229m H1 2019/20:
Newark (2019) Wanlip sludge scheme (2016) Melbourne high lift sump (2017) WFD scheme – Granby (2018) Birmingham Resilience (2020)up significantly over AMP6
12
13 13
PENSIONS
Settlement agreed with the Trustee for average contributions of £60m p.a. Strong asset performance, effective hedging strategy and sustainable cash contributions
Successful management in a challenging environment
Future contributions broadly in line with PR19 draft determination Contributions cease should the scheme move into surplus
£712m £575m £520m £453m £391m HY 16/17 FY 16/17 FY 17/18 FY 18/19 HY 19/20Consistently reducing deficit
14
GROUP SUMMARY
1. Underlying Profit before interest and tax (PBIT). 2. Underlying Earnings per Share (EPS) before amortisation of acquired intangible assets, net gains/losses on financial instruments, current tax on financial instruments and deferred tax. Reported basic EPS from continuing operations of 61.7p (2018/19: 69.8p). 3. Severn Trent Water Limited operating costs (excluding IRE and depreciation) down 9% on a real basis, flat in nominal terms. 4. Severn Trent Water Group (Severn Trent Water and Hafren Dyfrdwy combined) Net Debt/Regulatory Capital Value.Groundwork in place for a successful AMP7 STW & HD gearing 61.1%4 Sustainable Finance Framework STW operating costs down 9%3 Effective interest rate down 170bps PBIT1 £286.3m; EPS2 68.8p
In line with expectations, full year guidance unchangedGood H1 performance A successful AMP6 Strong AMP7 platform
15 15
Chief Executive
LIV GARFIELD
16
Improving service for customers
Over AMP6 we expect at least2↓50%
External sewer flooding↓6%
Leakage↓25%
Internal sewer flooding↓25%
WQ complaintsThe lowest bills and most trusted water company in England1
REFLECTING ON AMP6
RoRE outperformance across all levers
Cumulative RoRE of9.1%
£177m
£460m
170bps
Investing for the long term
Investing over£6bn
Self-generating51%
1,600km
~9%
Contributing to society
Annually helping over50,000
customers pay their billTop 3
Hampton-Alexander review AwardedGreen Economy
Mark by the LSETop 3
in Social Mobility Index16 17
STRONG PERFORMANCE IN WATER
H1 18/19 14 mins H2 18/19 6 mins H1 19/20 4 mins Supply interruptions: on track for 40% reduction year-on-year with 4 mins in H1 but winter still to come 2016/17 Actual 2017/18 Actual 2018/19 Actual 2019/20 Forecast 12% 6% Water quality complaints: delivering a 25% reduction over the AMPWell positioned on key measures as we head into AMP7
Actual - hit Target Actual - miss Forecast Leakage: expect to hit target for 8 in 9 years to deliver 6% AMP reduction – the second largest in the sector 11/12 12/13 13/14 14/15 15/16 16/17 17/18 18/19 19/20 18
SPOTLIGHT: SUPPLY INTERRUPTIONS
Insourcing specialist teams driving a second consecutive 40% reduction
Network Response team
with opex savings and penalty avoidance
Trunk Main Repair team
Team of experts to reduce the time and cost to fix complex and high-impact bursts Rapid response team, focused
during a supply interruption Prevent Restore Repair 18
19
OPERATIONAL EXCELLENCE
Positioning us well for a more rounded performance in AMP7
We earned our position as a leader on Waste early in the AMP through: We have taken some bold decisions to improve our Water performance in the second half of the AMP:
Expect a strong finish on Water
Interventions on Water typically take longer to impact performance but we are now seeing consistent improvement across key measures
A fast start to AMP6 on Waste
Insourcing core skills Innovative technology Smart investment Targeted interventions Upfront investment on key measures Targeted interventions on ‘hot spots’ Incentivisation for our people and supply chain
Hitting the£190m
Waste customer ODIs8%
below allowance AMP7 base totex plan below Ofwat allowance19
20
ENVIRONMENTAL LEADERSHIP
Investing to improve the environment we interact with every day
Water Framework Directive
Sustainable Sewage Treatment
Case study: ‘BioMag’
Iron ore used to process more water and produce a better quality effluent with existing assetsRecycling water back into the environment in a healthier state than when we abstracted it:
21
BIRMINGHAM RESILIENCE
Enhanced resilience for 1.2 million customers in Birmingham
£300m
investment New water treatment works
130Ml/d
new supply
26km
new pipe
Our largest ever engineering project 110,000 200,000
ZERO
texts sent facebook contacts water quality complaints
Enabling us to maintain the 119km gravity-fed Elan Valley Aqueduct The project required an extensive programme of customer and community engagement
theatre production to engage local community
21
22
AWESOME PLACE TO WORK
Creating the right culture makes us successful now and in the future
We care about our colleagues
We are embedding inclusivity
Our people are engaged
22
23
AMP7 BUILDING BLOCKS
Performance across AMP6 and fast-track preparation positions us well for AMP7…
UQ financing at 3.7%; launched Sustainable Finance Framework Strong operational improvement across Water and Waste Supply chain appointed and design team insourced Two thirds of £100m property profit commitment to come Focused non-reg business with growing EBITDA £177m of customer ODI revenue to be recognised in AMP7 AMP6 cost control puts us on the right totex glide path Performance driven culture and an engaged workforce
…underpinned by a strong and experienced management team 23
24 24
4 MARCH 2020 CAPITAL MARKETS DAY
Join us at Severn Trent Centre as we share our plans to create a sustainable future
25 25
26 26
27 27
FY20 TECHNICAL GUIDANCE
1. Includes £7 million net penalty for customer ODIs (Customer Outcome Delivery Incentives, quoted pre-tax in 19/20 prices) relating to 2017/18 with the balance of that year's net reward deferred to AMP7. 2. Quoted pre-tax at 2012/13 prices. 3. Excludes AMP6 SIM customer ODI outcome. 4. 2019/20 dividend growth is based on November 2018 RPI of 3.19% plus 4%. Regulated Water and Waste Water FY18/19 Year-on-Year Turnover1 £1.61 billion to £1.64 billion. £1.58bn ▲ Opex Higher year-on-year as continued upward sector-wide cost pressures from energy pass- through costs, licences and materials offset ongoing efficiency programmes. £600m ▲ IRE £145 million to £170 million. £141m ▲ Customer ODIs2,3 At least £25 million net reward across Water and Waste measures. £(5)m ▲ Business Services Underlying PBIT (excl. Property) Higher year-on-year. £44m ▲ Underlying Property PBIT £5 million to £10 million. £20m ▼ Group Interest charge Higher year-on-year due to increased total debt reflecting end of AMP investment in our capital programme and the acquisition of Agrivert in the second half of the prior year. £194m ▲ Tax rate Total tax rate of c.19% and underlying effective current tax rate between 10% and 12%. 11.6% ▼ Group capex £700 million to £800 million. £769m ↔ Dividend4 Annual dividend growth of at least RPI + 4% until March 2020. 2019/20 dividend set at 100.08p. 93.37p ▲ 28
UNDERLYING EBITDA¹ SIX MONTHS ENDED 30 SEPTEMBER 2019
1. Earnings from continuing operations before interest, tax, depreciation, amortisation and amortisation of acquired intangible assets. 2018 2019 Variance Variance £m £m £m % 428.0 Regulated Water and Waste Water 424.5 (3.5) (0.8) 51.5 Business Services 48.3 (3.2) (6.2) (6.8) Corporate and other (3.6) 3.2 47.1 0.3 Eliminations (0.1) (0.4) (133.3) 473.0 Severn Trent Group 469.1 (3.9) (0.8) 29
BUSINESS SERVICES UNDERLYING EBITDA¹ SIX MONTHS ENDED 30 SEPTEMBER 2019
1. Earnings before interest, tax, depreciation, amortisation and amortisation of acquired intangible assets. 2. Excluding amortisation of acquired intangible assets. Regulated £m Non Regulated £m Total £m Operating Services – 4.7 4.7 Energy (1.1) 9.9 8.8 Bioresources 25.1 – 25.1 Property Development 3.2 3.0 6.2 Other 1.8 1.7 3.5 Underlying EBITDA 29.0 19.3 48.3 Depreciation (12.5) (5.7) (18.2) Amortisation2 – (0.2) (0.2) Underlying PBIT 16.5 13.4 29.9 30
DEPRECIATION¹ SIX MONTHS ENDED 30 SEPTEMBER 2019
1. Including amortisation of intangible assets, before amortisation of acquired intangible assets. 2018 2019 Variance Variance £m £m £m % 159.6 Regulated Water and Waste Water 164.4 4.8 3.0 14.4 Business Services 18.4 4.0 27.8 – Corporate and other – – – (0.1) Eliminations – 0.1 100.0 173.9 Severn Trent Group 182.8 8.9 5.1 31
POWER SIX MONTHS ENDED 30 SEPTEMBER 2019
2018 2019 Segmental analysis Self generation Group Segmental analysis Self generation Group £m £m £m £m £m £m Turnover 31.0 (8.6) 22.4 Business Services 45.7 (8.2) 37.5 Cost (49.2) 8.2 (41.0) Regulated Water and Waste Water (51.4) 8.1 (43.3) (3.0) 0.4 (2.6) Business Services (2.0) 0.1 (1.9) (43.6) Severn Trent Group (45.2) 32
NET FINANCE COSTS SIX MONTHS ENDED 30 SEPTEMBER 2019
68.2 15.7 83.9 Cash interest (including accruals) 71.4 21.1 92.5 6.9 – 6.9 Net pension finance cost 5.4 – 5.4 18.0 – 18.0 Inflation uplift on index-linked debt 17.0 – 17.0 93.1 15.7 108.8 93.8 21.1 114.9 2018 2019 Income statement charge £m Capitalise d interest £m Gross interest incurred £m Income statement charge £m Capitalised interest £m Gross interest incurred £m 33
UNDERLYING EARNINGS PER SHARE SIX MONTHS ENDED 30 SEPTEMBER 2019
2018 £m 2019 £m Variance £m Variance % 299.1 Underlying profit before interest and tax 286.3 (12.8) (4.3) (93.1) Net finance costs (93.8) (0.7) (0.8) 206.0 Underlying profit before tax 192.5 (13.5) (6.6) (25.0) Tax at the underlying effective rate of 10.3% (2018: 12.1%) (19.9) 5.1 20.4 – Current tax in respect of prior years 0.4 0.4 100.0 (0.9) Share of net loss of joint ventures (9.3) (8.4) (933.3) 180.1 Earnings for the purpose of underlying basic and diluted earnings per share 163.7 (16.4) (9.1) 236.4 Weighted average number of ordinary shares for basic earnings per share 237.8 1.4 0.6 76.2 Underlying basic EPS from continuing operations 68.8 (7.4) (9.7) 34
GROUP BALANCE SHEET AT 30 SEPTEMBER 2019
31 March 2019 £m 30 September 2019 £m Variance £m Variance % 9,300.7 Property, plant and equipment, right-of-use assets, intangible assets and goodwill 9,590.7 290.0 3.1 37.0 Investments in joint ventures 27.7 (9.3) (25.1) 109.7 Working capital 46.1 (63.6) (58.0) (1,093.0) Deferred income (1,141.8) (48.8) (4.5) (452.9) Net retirement benefit obligations (390.6) 62.3 13.8 (51.4) Provisions (45.4) 6.0 11.7 (9.3) Current tax (0.2) 9.1 97.8 (747.5) Deferred tax (776.1) (28.6) (3.8) (95.1) Other derivative financial instruments (123.8) (28.7) (30.2) 6,998.2 Capital employed 7,186.6 188.4 2.7 1,164.1 Equity 1,229.8 65.7 5.6 5,834.1 Net debt 5,956.8 122.7 2.1 6,998.2 7,186.6 188.4 2.7 35
PENSION MOVEMENTS AT 30 SEPTEMBER 2019
31 March 20171 £m 31 March 2018 £m 31 March 2019 £m 30 September 2019 £m Total £m Opening net pension deficit (711.7) (574.6) (519.8) (452.9) Cash contributions 33.2 35.3 35.0 0.3 103.8 Return on plan assets 65.4 60.7 156.9 341.9 624.9 Changes in discount rate and other assumptions 172.0 28.5 (77.0) (241.8) (118.3) Changes to obligations from scheme experience (84.8) 1.9 39.0 (2.0) (45.9) GMP equalisation costs – – (9.6) – (9.6) Acquisition of Dee Valley Water 9.8 – – – 9.8 Finance and other costs (58.5) (71.6) (77.4) (36.1) (243.6) Closing net pension deficit (574.6) (519.8) (452.9) (390.6) 1. Opening net deficit position as at 1 October 2016. Pension deficit movements shown are for the six-month period to 31 March 2017. 36
CAPITAL EXPENDITURE (NET CASH)¹ SIX MONTHS ENDED 30 SEPTEMBER 2019
2018 2019 Variance Variance £m £m £m % 333.1 Regulated Water and Waste Water 369.2 36.1 10.8 4.2 Business Services 4.7 0.5 11.9 2.8 Corporate and other 0.2 (2.6) (92.9) 340.1 Severn Trent Group 374.1 34.0 10.0 1. Including purchases of property, plant and equipment, intangible assets, proceeds on disposal of property, plant and equipment and contributions and grants received. 37
NET DEBT AT 30 SEPTEMBER 2019
1. Average monthly debt was £5,902.9 million (2018: £5,547.7 million). 31 March 2019 £m 30 September 2019 £m Variance £m Variance % (1,120.1) Bank loans (1,196.6) (76.5) (6.8) (4,820.5) Other loans (4,842.7) (22.2) (0.5) (112.2) Finances leases/lease liabilities (128.7) (16.5) (14.7) 39.6 Net cash and cash equivalents 23.3 (16.3) (41.2) 37.1 Cross currency swaps 55.9 18.8 50.7 142.0 Loans receivable from joint ventures 132.0 (10.0) (7.0) (5,834.1) Net debt (5,956.8) (122.7) (2.1) 38
FAIR VALUE OF DEBT AT 30 SEPTEMBER 2019
31 March 2019 £m 30 September 2019 £m Variance £m Variance % (1,004.2) Floating rate debt (1,087.4) (83.2) (8.3) (3,969.9) Fixed rate debt (4,154.7) (184.8) (4.7) (2,298.3) Index-linked debt (2,566.0) (267.7) (11.6) (7,272.4) (7,808.1) (535.7) (7.4) 39.6 Net cash and cash equivalents 23.3 (16.3) (41.2) 142.0 Loans receivable from joint ventures 132.0 (10.0) (7.0) 37.1 Cross currency swaps 55.9 18.8 50.7 (7,053.7) Fair value of net debt (7,596.9) (543.2) (7.7) (5,834.1) Net debt (previous slide) (5,956.8) (122.7) (2.1) (1,219.6) Difference (1,640.1) (420.5) (34.5) 39
ANALYSIS OF BORROWINGS & NET DEBT AT 30 SEPTEMBER 2019
TO UPDATE
40
5,834.1 (496.5) (7.1) 374.1 133.1 95.5 23.6 5,956.8 Opening net debt Cash generated fromNET DEBT & CASH FLOW AT 30 SEPTEMBER 2019
41
DEBT MATURITY AS AT 30 SEPTEMBER 2019
42
GEARING AND CREDIT RATINGS AS AT 30 SEPTEMBER 2019
1. Estimated RCV at 30 September 2019. 2. Based on statutory net debt of £5,957m (31 March 2019: £5,834m). 3. Based on Severn Trent Water Group regulated net debt of £5,720m (31 March 2019: £5,777m) . 30 September 2018 31 March 2019 Net debt/RCV1 30 September 2019 59.6% 63.0% Severn Trent Group2 63.1% 59.0% 62.3% Severn Trent Water Group3 61.1% 31 March 2019 30 September 2019 Severn Trent Water Severn Trent Plc Severn Trent Water Severn Trent Plc Outlook A3 Baa1 Moody's A3 Baa1 Negative BBB+ BBB Standard and Poor's BBB+ BBB Stable