Gulf of Mexico Overview The Gulf of Mexico Most productive body of - - PowerPoint PPT Presentation

gulf of mexico overview the gulf of mexico
SMART_READER_LITE
LIVE PREVIEW

Gulf of Mexico Overview The Gulf of Mexico Most productive body of - - PowerPoint PPT Presentation

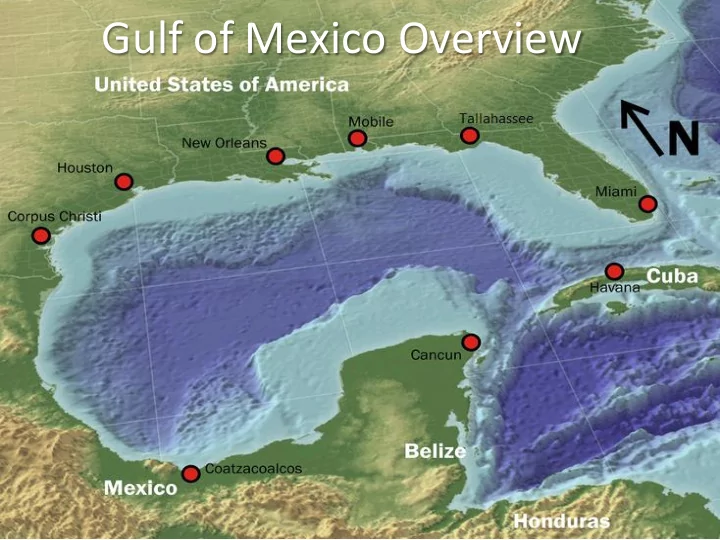
Gulf of Mexico Overview The Gulf of Mexico Most productive body of water in the World: 24 million marine recreational fishing 615,000 sq miles trips/year Contains 643 quadrillion gallons of water 47% of recreational catch is released


slide-1
SLIDE 1

Gulf of Mexico Overview

slide-2
SLIDE 2

The Gulf of Mexico

  • 615,000 sq miles
  • Contains 643 quadrillion gallons of water
  • 12,375 ft at its deepest point
  • Over 15,419 species in Gulf Waters
  • 1.3 billion pounds of commercial seafood
  • 44% of US marine recreational catch
  • 50% of the nation’s wetlands (100% of

mangroves)

  • Diversity Habitats - LMR: marsh & mangroves,

corals and seagrasses, fish, oysters, turtles, marine mammals, shorebirds, crabs and shrimp 24 million marine recreational fishing trips/year 47% of recreational catch is released 217 sq. miles converted from marsh to open water from Katrina & Rita

Most productive body of water in the World:

slide-3
SLIDE 3

Vital economic engine for the Nation:

  • 8.3 million coastal jobs (>120,000 oil & gas)
  • Nearly 4,000 active oil & gas platforms
  • $5–6 billion annually to the U.S Treasury
  • Transportation corridor for the world
  • Key to the energy security of the nation
  • Largest watershed in North America
  • The nation benefits, the region suffers

$359 billion in wages − $15.6billion in oil & gas wages 8% of the jobs are in tourism & recreation The population of the Gulf Region increased by 109% since 1970

The Gulf of Mexico

slide-4
SLIDE 4

Vital economic engine for the Nation:

  • > 56 Million People live in Gulf states,

21 million in coastal area

  • 70% of total U.S. Shrimp Landings
  • 62% of U.S. Oyster Landings
  • 7th in global Gross Domestic Product
  • 50% of the nation’s trade tonnage
  • >50% of National Oil & Gas Production
  • ~50% of National Refinery Capacity

The Gulf of Mexico

slide-5
SLIDE 5

Extensive Oil and Gas Structures

slide-6
SLIDE 6

More on Population Distribution

slide-7
SLIDE 7
  • Sustaining Gulf Economy
  • Habitat Loss (subsidence)
  • Sediment Management
  • Excessive Nutrients (Water Quality)
  • Tropical Storms
  • Man-made disasters
  • Fresh-Water Inflow
  • Sea Level Rise
  • Seafood Safety
  • Population Shifts
  • Fresh Water Inputs
  • Harmful Algal Blooms
  • Invasive Species
  • Transportation
  • Beach Closures

Gulf Challenges

slide-8
SLIDE 8

Tropical Storms

  • MS/Louisiana Recovery Road-map
  • Gulf Coast Ecosystem Restoration Task Force
  • RESTORE

HURRICANE KATRINA

Gulf Challenges and Opportunities

slide-9
SLIDE 9

Deep Water Horizon

  • Clean-up
  • Data Collection
  • RESTORE, NRDA, NFWF
  • Clean-Water Enforcement
  • Research

Gulf Challenges and Opportunities

slide-10
SLIDE 10

Previous Spills

slide-11
SLIDE 11

Coastal Land Loss

  • 3.4 Million Acres of Wetlands
  • Losing an area the size of a football field every 38 minutes
  • 2,400 sq. miles by 2050

Gulf Challenges and Opportunities

slide-12
SLIDE 12

2nd Largest Hypoxic Zone in the World

Gulf Challenges and Opportunities

slide-13
SLIDE 13

Hypoxic Area New Orleans

slide-14
SLIDE 14

Loss of Natural Flood Storage

slide-15
SLIDE 15

Sources of Nutrients into the Gulf

slide-16
SLIDE 16

MORE on the ongoing activity dealing with the oil spill…

slide-17
SLIDE 17

Natural Resource Damage Assessment (NRDA)

  • How bad was the injury?; what do we do to recover from the injury?
  • Paid for by responsible parties through the Oil Pollution Act

RESTORE Act

  • Passed by Congress & signed by the President in 2012
  • Lays out a program to spend Clean Water act Civil fines for

restoration and economic development activities National Fish & Wildlife Foundation (NFWF)

  • NFWF chartered by Congress as independent 501(c)(3) in 1984
  • Stemming from criminal plea: Gulf Environmental Benefit Fund
  • $2.544 B over 5 years

Largest Oil-Spill Related Revenue Streams

slide-18
SLIDE 18

Clean Water Act Penalties

20%

Oil Spill Liability Trust Fund

80% Gulf Coast Restoration Trust Fund

35% 30% 30% 2.5% 2.5%

Evenly split among the 5 Gulf states

Alabama Gulf Coast Recovery Council

AL

75% to most impacted counties

FL

25% to other coastal counties based

  • n allocation formula

70% to the state

LA

30% to coastal parishes based on allocation formula Department of Environmental Quality

MS TX

Governor’s Office To Gulf Coast Ecosystem Restoration Council to implement the Compre- hensive Plan

(supplemented by 50%

  • f the interest generated

by the Trust Fund)

To the states consistent with the goals and objectives of the Comprehensive Plan and based

  • n the following allocation

Formula:

  • The proportion of the number of miles of
  • iled shoreline per state compared to total

number of miles of oiled shoreline;

  • The inverse proportion of the average

distance from the DWH rig to oiled shoreline of each state;

  • The average population of coastal

counties per the 2010 census.

TX MS LA FL AL

NOAA Gulf Coast Ecosystem Restoration Science Observation Monitoring And Technology Program

(supplemented by 25% of the interest generated by the Trust Fund)

Centers of Excellence

(supplemented by 25% of the interest generated by the Trust Fund)

4/16/2014 18

RESTORE Act Structure

slide-19
SLIDE 19

A Process Model Highlighting Overlap and Coordination Challenges

(yes, this is going to make your head hurt)

slide-20
SLIDE 20

Project Idea Layer

P P P P P P P P P P P P P

slide-21
SLIDE 21

Assessment Research Restoration Economic Development

Project Category Layer Project Idea Layer

P P P P P P P P P P P P P Monitoring

slide-22
SLIDE 22

Assessment Research Restoration Economic Development

Project Category Layer Project Idea Layer

Project Acceptance, Priority Setting & Funding Layer

P P P P P P P P P P P P P Monitoring

slide-23
SLIDE 23

Project Acceptance, Priority Setting & Funding Layer

  • Each face of this geometric figure represents a distinct entity with its own

funding authority.

  • Each entity has its own: mission / function

requirements governance set of players anticipated projects to fulfill mission objectives

A Closer Look at this Layer…

  • There is significant overlap across the entities in mission, anticipated projects,

and players

  • This model is illustrative – not inclusive of all case resolutions.
slide-24
SLIDE 24

Assessment Research Restoration Economic Development

Project Category Layer Project Idea Layer Project Acceptance, Priority Setting & Funding Layer

P P P P P P P P P P P P P

Project Delivery & Management Layer

Monitoring

slide-25
SLIDE 25

Monitoring Assessment Research Restoration Economic Development

Project Category Layer Project Idea Layer Project Acceptance, Priority Setting & Funding Layer

P P P P P P P P P P P P P

Project Delivery & Management Layer IT

It’s so simple, what could possibly go wrong?

slide-26
SLIDE 26

Assessment Research Restoration Economic Development

Project Category Layer Project Idea Layer Project Acceptance, Priority Setting & Funding Layer

P P P P P P P P P P P P P

Project Delivery & Management Layer

Monitoring

slide-27
SLIDE 27

Assessment Research Restoration Economic Development

Project Category Layer Project Idea Layer Project Acceptance, Priority Setting & Funding Layer

P P P P P P P P P P P P P

Project Delivery & Management Layer

Monitoring

slide-28
SLIDE 28

Assessment Research Restoration Economic Development

Project Category Layer Project Idea Layer Project Acceptance, Priority Setting & Funding Layer

P P P P P P P P P P P P P

Project Delivery & Management Layer

Monitoring

slide-29
SLIDE 29

Assessment Research Restoration Economic Development

Project Category Layer Project Idea Layer Project Acceptance, Priority Setting & Funding Layer

P P P P P P P P P P P P P

Project Delivery & Management Layer

TILT

Monitoring

slide-30
SLIDE 30

Assessment Research Restoration Economic Development

Project Category Layer Project Idea Layer Project Acceptance, Priority Setting & Funding Layer

P P P P P P P P P P P P P

Project Delivery & Management Layer

Monitoring

S

So, What Do We Do About This?

slide-31
SLIDE 31

Assessment Research Restoration Economic Development

Project Category Layer Project Idea Layer Project Acceptance, Priority Setting & Funding Layer

P P P P P P P P P P P P P

Project Delivery & Management Layer

Monitoring

S

So, What Do We Do About This?

  • Talk (and listen) to each other

1) At leadership level

  • Understand mission objectives and processes
  • Significant overlap between NRDA and RESTORE already exists

2) At science level

  • A lot of work is underway or done; don’t recreate the wheel

3) At public level

  • find and advertise ways for public stakeholders to become and stay

engaged

slide-32
SLIDE 32

Assessment Research Restoration Economic Development

Project Category Layer Project Idea Layer Project Acceptance, Priority Setting & Funding Layer

P P P P P P P P P P P P P

Project Delivery & Management Layer

Monitoring

S

So, What Do We Do About This?

  • Talk (and listen) to each other

1) At leadership level

  • Understand mission objectives and processes
  • Significant overlap between NRDA and RESTORE already exists

2) At science level

  • A lot of work is underway or done; don’t recreate the wheel

3) At public level

  • find and advertise ways for public stakeholders to become and stay

engaged

  • Seek outcomes that are sustainable and partnership driven
  • e.g. Florida NEP proposal; the Nature Conservancy
slide-33
SLIDE 33

Questions?

Ben Scaggs

Gulf Coast Ecosystem Restoration Council EPA Gulf of Mexico Program 228-688-3726 scaggs.ben@epa.gov

Keala Hughes

Gulf of Mexico Program US EPA 228-688-2651 hughes.keala@epa.gov