Green Space in a Resilient City Centre for Sustainable Cities lecture - - PowerPoint PPT Presentation
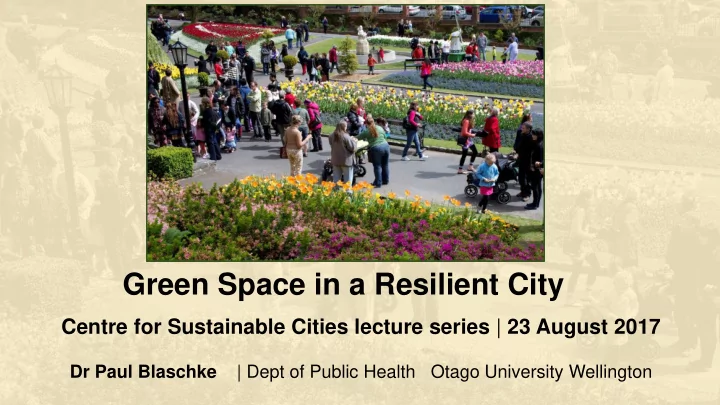
Green Space in a Resilient City Centre for Sustainable Cities lecture series | 23 August 2017 Dr Paul Blaschke | Dept of Public Health Otago University Wellington Why are green spaces good for you? What do we know about New Zealand urban
- Why are green spaces good for you?
- What do we know about New Zealand urban green spaces?
- How much green space do we need in Wellington/NZ?
- What do we want from our green spaces in Wellington City?
How do natural places / green spaces facilitate health and wellbeing?
- Three main ways:
– direct restorative mental and physical effects, e.g.
- recovery from stress
- improved moods
- mental recharging
- reduced blood sugar levels
- Better immune system functioning
– by providing opportunities to undertake physical activity; – by facilitating the development of social capital;
Hartig, Terry, et al. "Nature and health." Annual review of public health 35 (2014): 207-228
Brisbane, Australia
Shanahan et al 2016 Sci report. Health Benefits from Nature Depend on Dose
Solution
‘NATURE DOSE’
Frequency Duration Intensity
Health response to a dose of nature
Shanahan et al. 2015 BioScience
Nature dose Frequency Duration Intensity Health response High blood pressure Depression Social cohesion Physical activity
Nature dose & health
Nature dose Frequency Duration Intensity Health response High blood pressure
Depression
Social cohesion
Physical activity
Nature dose & health
Continuum of natural areas
Urban park Private garden Peri-urban green area Scenic reserve Large wilderness area Private domestic green space Mainly public built/managed green space Urban street scape Public “wild” green space
Clarkson, B. D., Wehi, P. M., & Brabyn, L. K. (2006). Bringing back nature into cities: Urban land environments, indigenous cover and urban
- restoration. Report 52, Centre for Biodiversity and Ecology Research, University of Waikato.
- More than 86% New Zealanders live in cities and towns
- NZ cities are well-endowed with urban green space
- In the 20 largest NZ cities:
- % urban parkland averages 7.3% of area (range 3.5 – 11.4%)
- % native vegetation cover averages 2% of area (range 1 – 8.5%)
- Mean number of native vegetation patches is 42
Overview of NZ urban green spaces
Who uses Urban Green Spaces? Wellington Botanic Garden
- 1m visits annually (2012)
– 38% Wellington, 20% other NZ, 42%
- verseas
- 70% visit with other people
– 28% with partner/spouse, 20% with family (14% with children <15), 18% with friends
- Main activities walk/exercise, view
plants, relax
- Visitors have very high satisfaction
with their visit
- Sometimes children’s first experience
- f nature
Wgtn Botanic Garden Visitor Services Quality Review 2012 (Univ South Australia)
New Zealand Garden study, Dunedin
- Domestic gardens make up
approximately 36% of all Dunedin urban land
- 46% of the residential area
- Largest single land use
- Benefits
- stress reduction
- social connections
- environmental stewardship and
awareness
- biodiversity increase
Otago Daily Times
Freeman C et al 2012. J Environmental Psychology 32:135–143. Mathieu C et al J 2007. Landscape and Urban Planning 81: 179–192.
- Relationship is strongly income-related
Mitchell R, Popham F 2007Journal of Epidemiology and Community Health, 61(8), 681-683 Mitchell R, Popham F 2008. Lancet, 72(9650), 1655-1660 Astell-Burt T et al 2014, BMC Public Health, 14: 292
- These conclusions may not hold true
in New Zealand and also in some other parts of the world
Witten et al 2008 Preventive Medicine 47, 299-303 Richardson et al 2010 BMC Public Health 10, 240
- especially where much of the population
enjoy good access to green/blue areas even when living in large urban centres or in deprived areas.
Relationship between increasing urbanisation, decreasing greenness and resultant health effects
Green space access in Wellington
Freeman MPH thesis 2017
- 83, 11-13 yr old Wellington region students
monitored over 4 days in 2014/5 summer
- Green space setting and activity recorded. Public
playing fields and private gardens were the two types
- f GS most frequently visited
- Students from high decile schools (low deprivation)
visited green space on average at least five times more than those from middle deciles and twice as much as those from low decile schools.
- On average girls visited green space twice more
frequently than boys and spent three times more time per visit to green space than males.
- Students were almost always with another person,
more than half the time with an adult
Nadia Freeman: Children’s recreational use of green spaces: Impact of household deprivation and green space characteristics. Masters Public Health thesis (submitted), University Otago Wellington.
https://diet.auckland.ac.nz/content/kidscam
Distribution of green space in four Wellington City neighbourhoods
- Centre for Sustainable Cities exploratory study (Fiona
Chan, 2016-17 summer studentship)
- 4 contrasting Census Area Units in Wellington City.
Census Area Unit 2013 Census Total Population Total Land Area (ha) Khandallah Park – Broadmeadows (low dens /low dep) 2796 100 Linden (low dens /high dep) 3999 151 Oriental Bay (high dens /low dep) 1056 16 Willis Street – Cambridge Terrace (high dens /high dep) 7329 103
Distribution of green space in 4 Wellington City neighbourhoods
Census Area Unit Total area parks & road reserve (ha) Total GS in parks & road reserve (ha) GS as % of public parks / road reserve Total public GS as % of CAU area Total public GS (m2/head) Khandallah Park – Broadmeadows (low dens /low dep) 24.2 12.4 51% 12.4% 44.5 Linden (low dens /high dep) 53.6 32.0 60% 21.2% 80.1 Oriental Bay (high dens /low dep) 4.6 1.1 25% 7.2% 10.9 Willis Street – Cambridge Terrace (high dens /high dep) 31.8 3.6 11% 4.9% 4.9
Victoria University Green Spaces study
- Between 1990-2015 there was net loss
- f 69 species from the campus
- More loss of introduced than native species
- Loss of large trees
- What do you want more of?
- sunny spots
- “birds & bees & trees”
- Seats
- If student/staff numbers grow, green
space demand may outstrip supply
Forsyth, F 2016. Biodiversity Planning for VUW’s Kelburn Campus” VUW, MSc thesis
Summary: what NZ cities offer for green space
- Well endowed with green space
- Relatively good access (but
some disparities)
- Generally high quality parks
and urban spaces
- Wonderful natural settings
(including some close to cities)
- Some good programmes
- e.g. Green Prescription
Photos: Sport Wellington TL, www.newzealand.com BL, Mana Cycle Group, BR
Could we have too much green space in Wellington City?
Green spaces as providers of multiple ecosystem services
- Transport
- Water management
- Food supply
- Climate regulation
- Resilience
- etc, etc
To provide for and maximise these ecosystem services we need to consider:
- Quality of green/blue space
- Accessibility of green/blue
space
- Public/private/third space
balance
- Needs of different population
groups
- children, elderly, disabled, ethnic
and cultural minorities
- None of these principles is
defined only by absolute quantity
- Quantity, quality and
accessibility are all critical
What would we want from our green spaces in Wellington?
Many thanks to:
Distribution of green space in 4 Wellington City neighbourhoods
Census Area Unit Total area parks and road reserve (m2) Total GS within parks and road reserve (m2) GS as % of public parks / road reserve Total public GS as % of CAU area Total public GS (m2/person) Khandallah Park – Broadmeadows (low dens /low dep) 241691 124374 51% 12.4% 44.5 Linden (low dens /high dep) 536100 320289 60% 21.2% 80.1 Oriental Bay (high dens /low dep) 45641 11460 25% 7.2% 10.9 Willis Street – Cambridge Terrace (high dens /high dep) 317614 35705 11% 4.9% 4.9 Census Area Unit Total area private GS (m2) Total public and private GS (m2) Public/privat e GS ratio Total GS as % of CAU area Total GS (m2/person) Khandallah Park – Broadmeadows (low dens /low dep) 454065 578439 0.273 57.7% 207.0 Linden (low dens /high dep) 563126 883415 0.569 58.5% 220.9 Oriental Bay (high dens /low dep) 49290 60750 0.23 38.2% 198.3 Willis Street – Cambridge Terrace (high dens /high dep) 19887 55592 1.80 7.6% 7.6
- Strong disparities in green space availability between the four CAUs, both in absolute
area and in availability per person.
- Disparities are especially marked in the inner city CAUs
GS distribution/ access 5 largest cities in Australia
Astell-Burt et al. (2014). Do low-income neighbourhoods have the least green space? BMC Public Health, 14: 292
- Green space availability was
substantively lower in areas with a higher percentage of low income residents, in all cities
- This association varied between
cities (Adelaide most inequitable; Melbourne least inequitable)
Types of urban green and open spaces
- Public green space (“Usable”,
“accessible”)
- Significant degree of vegetation cover
- Usually permeable surfaces
- Private green space
- Permeable and impermeable surfaces
- Private gardens and yards
- Public open space
- Lower vegetation cover
- Road reserves / verges
- Private open space
- Informal green/open space
- “Undeveloped” or unvegetated
land
- Vacant lots, extensive paved
areas, railway/motorway banks
- “Third Space”
- Elements of all
Ecosystem services approach
- “What does the environment do for me?”
- Ecosystem services:
– “the benefits that humans receive from nature” – “Nature’s goods and services’ – require healthy functioning ecosystems
For example:
- Production of food and fibre
- Cycling nutrients
- Purifying water
- Decomposing wastes
- Providing pollination and pest control
- Regulating local and global climates
- Recreation & human health
The health effects of UGS-based recreation – how much, what dose and where in New Zealand?
- Karen Witten: Investigated neighbourhood access to parks and
beaches as a predictor of Body Mass Index and physical activity levels (specific interest in recreation)
- Little evidence of an association between locational access
to open spaces and physical activity
- Most of our population enjoy good access to green/blue areas
even when living in large urban centres or in deprived areas
- Nationally, most access is by car (72% of trips)
Witten K et al 2008. Neighbourhood access to open spaces and the physical activity of residents: a national study. Preventive Medicine Vol 47
Urban green space and mental health in Auckland City
- Daniel Nutsford et al - Tested the relationship between
access to green space and area-level anxiety/mood disorder treatment counts across Auckland
- Nearness to greenspace and also high proportions of
greenspace in a neighbourhood was negatively correlated with anxiety/mood disorder, i.e. “protective”
- Benefits of green space for mental health may relate both
to active participation in green spaces near to the home, and total green space in the neighbourhood environment.
Nutsford D et al 2013. An ecological study investigating the association between access to urban green space and mental health. Public Health Vol 127
Census Area Unit Total area parks & road res. (ha) Total GS in parks & road reserve (ha) GS as % of public parks / road reserve Total public GS as % of CAU area Total public GS (m2 /person) Total area private GS (ha) Total public & private GS (ha) Public /private GS ratio Total GS as % of CAU area Total GS (m2/ person) Khandallah Park – Broadmeadows (low dens /low dep)
24.2 12.4 51% 12.4% 44.5 45.4 57.8 0.273 57.7% 207.0
Linden (low dens /high dep)
53.6 32.0 60% 21.2% 80.1 56.3 88.3 0.569 58.5% 220.9
Oriental Bay (high dens /low dep)
4.6 1.1 25% 7.2% 10.9 4.9 6.1 0.23 38.2% 198.3
Willis Street – Cambridge Terrace (high dens /high dep)
31.8 3.6 11% 4.9% 4.9 2.0 5.6 1.80 7.6% 7.6
Distribution of green space in 4 Wellington City neighbourhoods
Urban Vegetation, Wellbeing and Pro-environmental Behaviour Julie Whitburn MSc 2014
- Investigated whether engagement with urban
nature influenced the wellbeing and pro- environmental behaviour of residents of Wellington City
- Quantified vegetation levels in 20
neighbourhoods and postal survey of 423 residents in these areas
- Models assessed relationships with nature and
self-assessed personal wellbeing
- Findings suggest “promotion of time in nature
and increases in amount of urban planting may be effective public health intervention and also result in increased pro-environmental behaviour”
- Stratified random sample of
20 neighbourhoods across Wellington City - varied in their amount and type of vegetation cover
Is there an optimal amount of green space in a city?
- Berlin survey: positive effect of
green space was greatest at 11%
- f a 1-km diameter ‘buffer area’
around an individual’s residence
- Could the marginal benefit of GS
start to decline at more than this figure?
- Assuming that:
- overall population density is lower
when GS density is higher
- population density associated with
- ther urban values