SLIDE 40 In a general sense, a PGM of a system
- clusters information into local sections, and
- let the sections communicate about their combined outcome
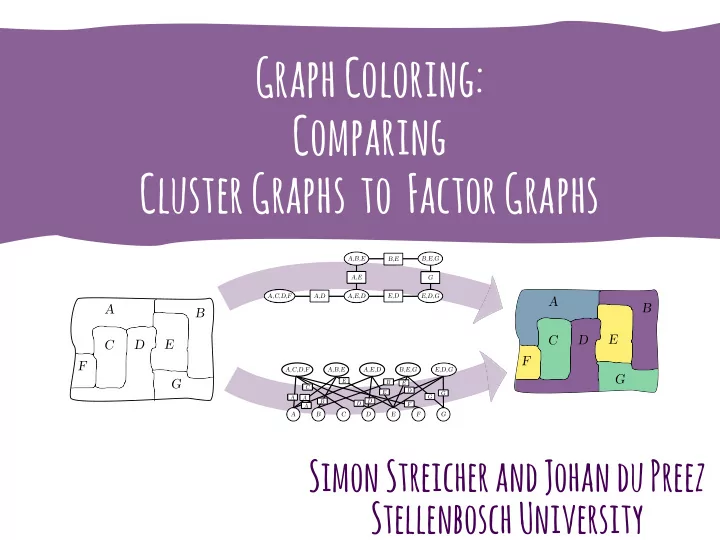
A B C D E F G A,C,D,F B,E,G A,B,E D,E,G A,D,E
Factor/Bethé graph
A,D,E A,B,E A,C,D,F B,E,G E,D,G A B F G C D E
A B C D E F G A B D E G A D E
Cluster graph
A,D E,D A,D,E A,E A,B,E B,E A,C,D,F B,E,G E,D,G G
Factor/Bethé graph
A,D,E A,B,E A,C,D,F B,E,G E,D,G A B F G C D E
A B C D E F G A B D E G A D E
Cluster graph
A,D E,D A,D,E A,E A,B,E B,E A,C,D,F B,E,G E,D,G G
Cluster graph
A,D E,D A,D,E A,E A,B,E B,E A,C,D,F B,E,G E,D,G G
PROBABILISTIC GRAPHICAL MODELS