
SLIDE 1
Geography challenge
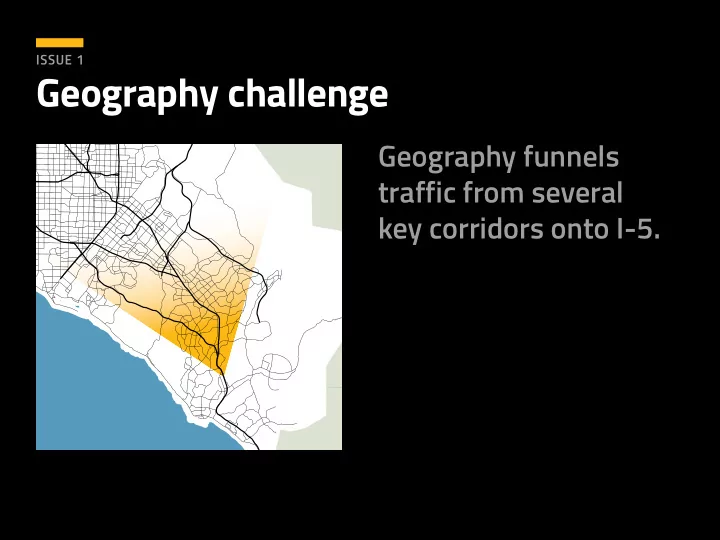
Geography funnels traffic from several key corridors onto I-5.
ISSUE 1
Geography challenge Geography funnels traffic from several key - - PowerPoint PPT Presentation
ISSUE 1 Geography challenge Geography funnels traffic from several key corridors onto I-5. ISSUE 2 Less redundancy Northern OC has a dense network of roadways for traffic to shift to during unexpected incidents. Southern OC has a limited
ISSUE 1
ISSUE 2
ISSUE 3
Fire station Hospital
ISSUE 4
Rail station
ISSUE 5
ISSUE 6
AUTO TRANSIT BIKE WALK O C S C A L C A
ISSUE 7
EXISTING FUTURE (2035) WITH EXISTING INFRASTRUCTURE VEHICLE HOURS TRAVELED
HOURS OF DELAY
ROADWAY CONGESTION
405 5 5 5 261 133 133 241 73 1 74 55 Irvine Center Dr Irvine Blvd Muirlands Blvd Marguerite Pkwy Antonio Pkwy O s
k w y Alicia Pkwy Moulton P k w y Pkwy Valley Crown C a m i n
e l A v i
Ortega Hwy A v e P i c
Bake L a k e F
e s t D r Pkwy Jamboree Rd Culver Dr University Dr Newport Coast Dr Sand Cyn Ave T r a b u c
d
Volume to capacity (V/C) ratio
≤0.8 ≥1.0 0.8-1.0
ROADWAY CONGESTION
T R A V E L D E M A N D M O D E L S O C I O
C O N O M I C L A N D U S E / V E H I C L E V O L U M E O N S T R E E T S V E H I C L E T R I P S C O N G E S T E D T R A V E L T I M E M O D E S H A R E I N F R A S T R U C T U R E
C A L S T A T E F U L L E R T O N C I T I E S S C A G O C T A
Major model inputs Analysis Model outputs
ROADWAY CONGESTION
405 5 5 5 261 133 133 241 73 1 74 55 Irvine Center Dr Irvine Blvd Muirlands Blvd Marguerite Pkwy Antonio Pkwy O s
k w y Alicia Pkwy Moulton P k w y Pkwy Valley Crown C a m i n
e l A v i
Ortega Hwy A v e P i c
Bake L a k e F
e s t D r Pkwy Jamboree Rd Culver Dr University Dr Newport Coast Dr Sand Cyn Ave T r a b u c
d
Volume to capacity (V/C) ratio
≤0.8 ≥1.0 0.8-1.0
ROADWAY CONGESTION
ROADWAY CONGESTION
405 5 5 5 261 133 133 241 73 1 74 55 Irvine Center Dr Irvine Blvd Muirlands Blvd Marguerite Pkwy Antonio Pkwy O s
k w y Alicia Pkwy Moulton P k w y Pkwy Valley Crown C a m i n
e l A v i
Ortega Hwy A v e P i c
Bake L a k e F
e s t D r Pkwy Jamboree Rd Culver Dr University Dr Newport Coast Dr Sand Cyn Ave T r a b u c
d
Volume to capacity (V/C) ratio
≤0.8 ≥1.0 0.8-1.0
POTENTIAL IMPROVEMENTS
Features
9 9 11 11 8 8 4 4 4 6 6 2 2 1 1 3 3 12 12 13 13 13 10 10 10 5 5 5 7 7 Bike parking Real-time transit info Informational kiosk On-demand rideshare Shared mobility services Smart intersection Electric vehicle charger Smart parking Package delivery Pedestrian facilities Protected bikeway Universal transportation account Mixed-use development
POTENTIAL IMPROVEMENTS Alternative interchange forms Roadway extensions Arterial HOV lanes Arterial widening Interchange widening
POTENTIAL IMPROVEMENTS Express bus usage
First/last mile shuttle buses Rail double-tracking (or more sidings) New or improved bus service
POTENTIAL IMPROVEMENTS Bikeways and active transportation solutions