
SLIDE 1
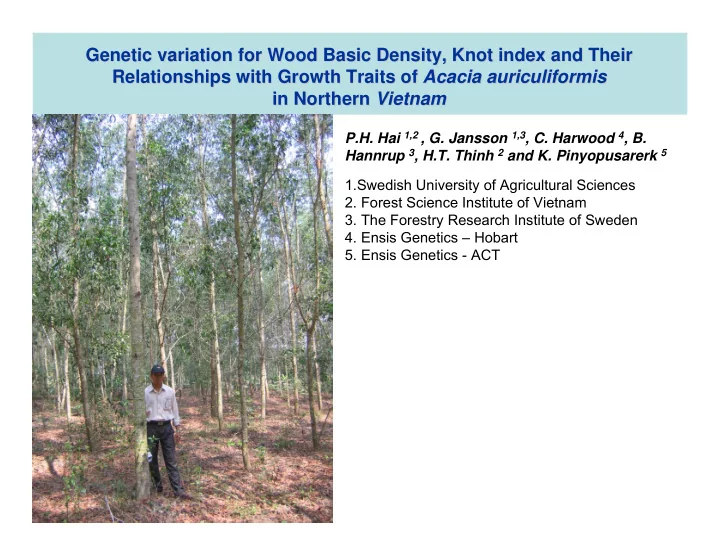
Genetic variation for Wood Basic Density, Knot index and Their Genetic variation for Wood Basic Density, Knot index and Their Relationships with Growth Traits of Relationships with Growth Traits of Acacia Acacia auriculiformis auriculiformis in Northern in Northern Vietnam Vietnam
P.H. Hai 1,2 , G. Jansson 1,3, C. Harwood 4, B. Hannrup 3, H.T. Thinh 2 and K. Pinyopusarerk 5 1.Swedish University of Agricultural Sciences
- 2. Forest Science Institute of Vietnam
- 3. The Forestry Research Institute of Sweden
- 4. Ensis Genetics – Hobart
- 5. Ensis Genetics - ACT