
SLIDE 1
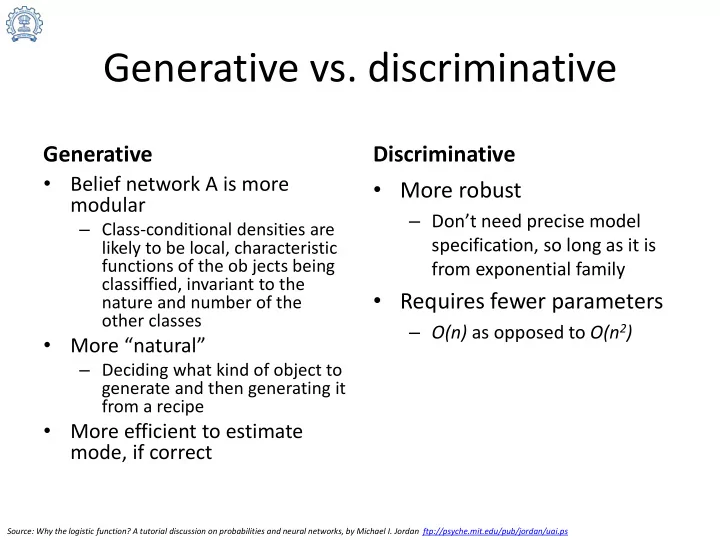
Generative vs. discriminative
Generative
- Belief network A is more
modular
– Class-conditional densities are likely to be local, characteristic functions of the ob jects being classiffied, invariant to the nature and number of the
- ther classes
- More “natural”
– Deciding what kind of object to generate and then generating it from a recipe
- More efficient to estimate
mode, if correct
Discriminative
- More robust
– Don’t need precise model specification, so long as it is from exponential family
- Requires fewer parameters
– O(n) as opposed to O(n2)
Source: Why the logistic function? A tutorial discussion on probabilities and neural networks, by Michael I. Jordan ftp://psyche.mit.edu/pub/jordan/uai.ps